


Gold investors are currently focused on several key questions regarding the future direction of prices, such as:
Will the yellow metal resume its upward trend?
Were the $5,600 levels the peak of its recent movement?
And does gold still represent a safe haven amid current market volatility?
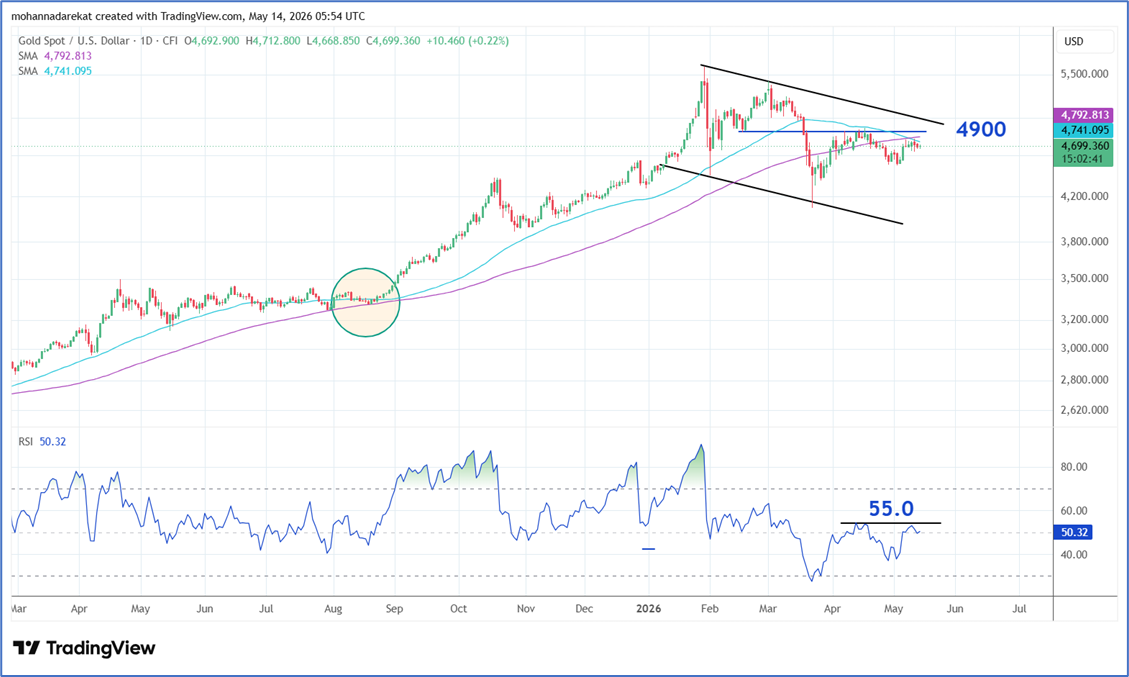
To answer these questions, we will monitor price action through the attached chart, which shows that prices are currently facing selling pressure.
This is mainly due to prices remaining under the control of the downward trendline and trading below the 50-day and 100-day moving averages.
Despite the negative nature of these signals, they also clearly indicate when prices may regain positive momentum. The 4,900-dollar level is considered one of the most significant resistance zones for gold, and a successful breakout above it could signal the resumption of the upward trend.
This area represents a convergence of key technical resistance levels, moving averages, and the descending channel trendline, in addition to being a previous peak recorded in mid-April.
As for the Relative Strength Index (RSI), it is essential for the indicator to move above the 55 level in order to confirm the return of positive momentum.In conclusion, we will closely monitor the $4,900 level along with the RSI 55 level before turning optimistic about gold prices from a technical perspective.
-1780480761.webp)

-1779182936.webp)