


-1779182936.webp)
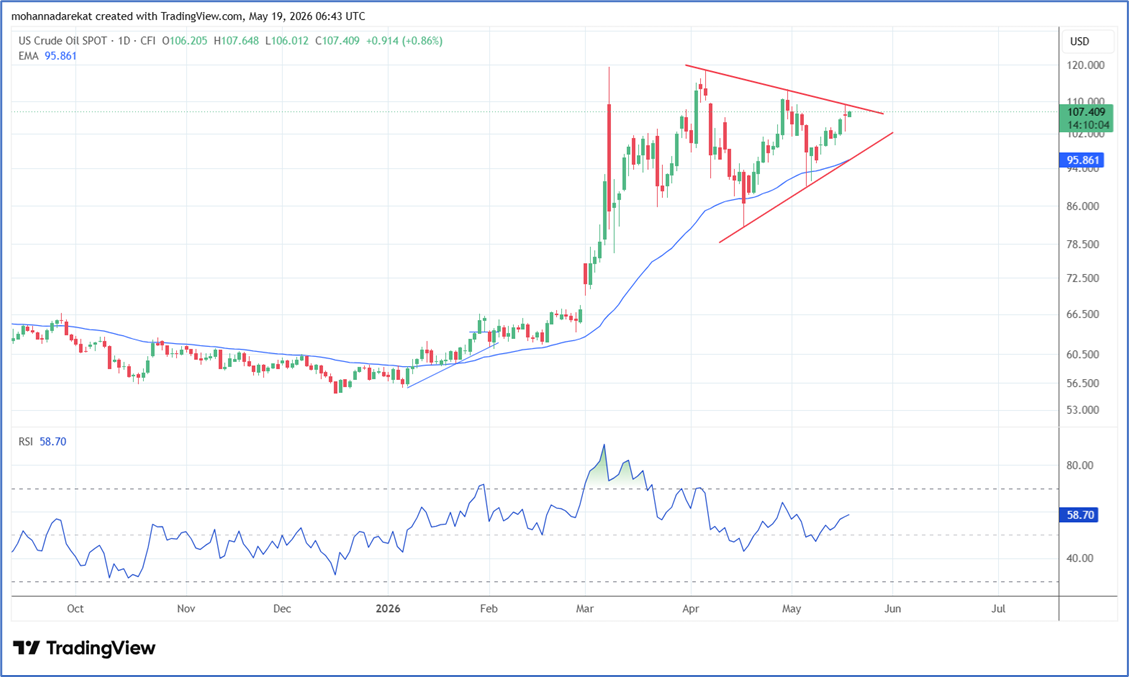 WTI/USD, Time frame: daily chart, Tools: EMA50, Source: Tradingview
The US strategic petroleum reserve has fallen to its lowest level in two years, while the International Energy Agency warned that commercial oil inventories are being depleted rapidly, with only enough supply remaining for a few more weeks.
This comes amid slow-moving negotiations surrounding the Middle East crisis, as markets await the U.S. Energy Information Administration’s crude oil inventory report due on Wednesday.
With the effective closure of the Strait of Hormuz and continued uncertainty surrounding the situation, oil prices continue to fluctuate within a “Symmetrical Triangle” pattern, as illustrated in the attached chart. Technical analysis suggests the possibility of sharp price movements should prices break above the triangle’s resistance level or fall below its support level. Therefore, the levels near $113.5 and $91 remain key and pivotal price zones for the market direction.
-1785397617.webp)
-1785230374.webp)
-1784545062.webp)
