


Summary:
Whether you own individual stocks or invest through an S&P 500 index fund, the crude oil market deserves your attention. Oil is not simply an energy story—it shapes inflation, household purchasing power, corporate profit margins, and equity valuations. The spot price matters, but the WTI futures curve offers a richer picture of how traders are pricing near-term supply, demand, and risk across time.
What the WTI Futures Curve Is Saying
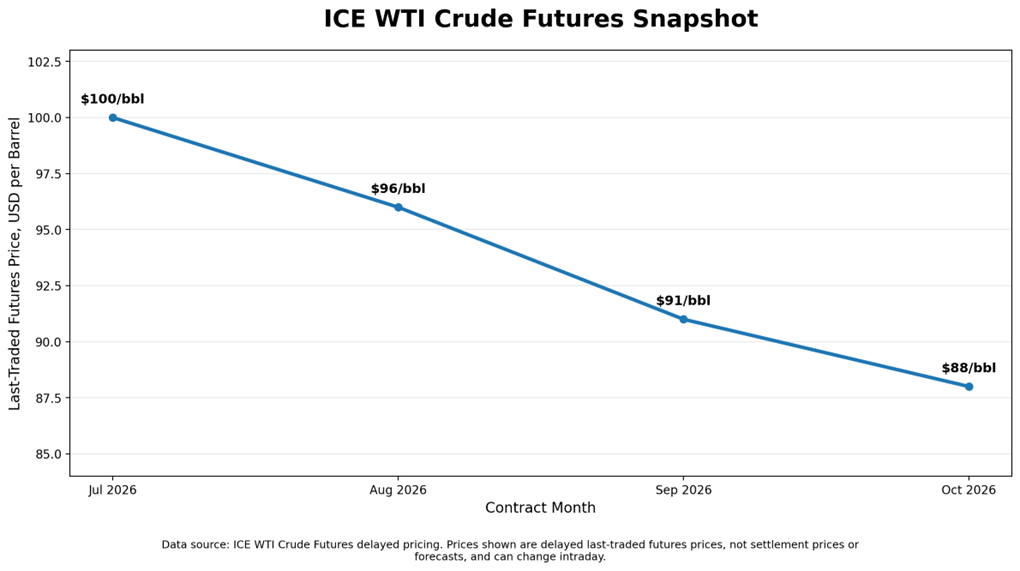
As of the ICE delayed-pricing snapshot on May 20, 2026, at 4:47 PM GMT, the WTI futures curve was in backwardation; nearer-dated contracts were priced above later-dated ones. Backwardation typically reflects tight physical supply, elevated near-term risk premiums, or a combination of both. The current episode is partly driven by OPEC+ production restraint and lingering geopolitical risk in key export regions, which have kept immediate delivery expensive relative to forward months.
Data source: ICE WTI Crude Futures delayed pricing. Prices are delayed last-traded futures prices, not settlement prices or forecasts, and can change intraday.
At that snapshot, ICE showed:
 Source: ICE data
· July 2026 WTI contract: $100 per barrel
· August 2026 WTI contract: $96 per barrel
· September 2026 WTI contract: $91 per barrel
· October 2026 WTI contract: $88 per barrel
That $12 drop from July to October is a steep descent. Historically, a similar steepness of backwardation was observed in mid-2022 and late 2018, both periods when near-term supply tightness eventually gave way to price normalization. The takeaway is not that oil is guaranteed to fall, but that the market is pricing in meaningfully lower energy costs over the next several months.
Oil, the Fed, and Stock Valuations
For equity investors, oil transmits through four main channels: inflation, consumer spending, corporate margins, and interest rates. When fuel prices rise, households have less to spend on discretionary categories—travel, dining, and retail. Energy-intensive businesses face higher input and logistics costs that compress margins if they cannot pass them through to customers.
If oil eases toward the levels implied by the forward curve, headline inflation pressure could moderate meaningfully. That alone would not compel the Federal Reserve to cut rates—policymakers also weigh core inflation, wage growth, and labor-market conditions. But softer energy costs remove one obstacle. In prior cycles, sustained declines in energy CPI have given the Fed political and analytical cover to pivot toward less restrictive policy, and equity multiples have often re-rated higher in anticipation.
Why Lower Oil Is Not Always Bullish
Not all oil price declines are created equal; the reason behind the drop matters just as much as the drop itself.
When oil falls because more supply is coming to market, OPEC+ members pumping above their agreed quotas, geopolitical tensions easing, or new production coming online, that's generally good news for stocks. Lower energy costs without any underlying economic weakness are a genuine tailwind for consumers and businesses alike.
But when oil falls because the global economy is slowing down, factories cut output, fewer goods are being shipped, businesses pulling back on orders — that's a warning signal, not a reason to celebrate. In that scenario, cheaper oil reflects shrinking demand, and stock prices often follow energy lower rather than bouncing up on the relief.
How to tell the difference: watch these four signals alongside oil
Copper prices are a useful cross-check, since the metal is used so widely in construction and manufacturing that traders call it "Dr. Copper" for its ability to diagnose economic health. Earnings estimates from analysts also matter: Are companies guiding higher or lower? Credit spreads (the extra interest rate that riskier companies pay to borrow) tell you whether lenders are feeling confident or nervous. And widening high-yield bond spreads is a classic sign that investors are bracing for stress in the corporate sector.
If oil is falling but copper holds steady, earnings estimates stay intact, and credit spreads remain tight, the market is likely pricing in supply-side relief, a positive setup for equities. If copper, earnings, and credit all deteriorate alongside oil, the message is that growth is weakening, and caution is warranted.
ConclusionConclusion
The WTI futures curve isn't a forecast, but the steep backwardation of $100 in July falling to $88 in October signals meaningful price relief ahead. For stock investors, that's potentially good news. But watch copper, credit spreads, and earnings. If they hold up, equities benefit. If they crack, lower oil is a warning.
-1785397617.webp)

-1785230374.webp)
-1784545062.webp)