


-1779358808.webp)
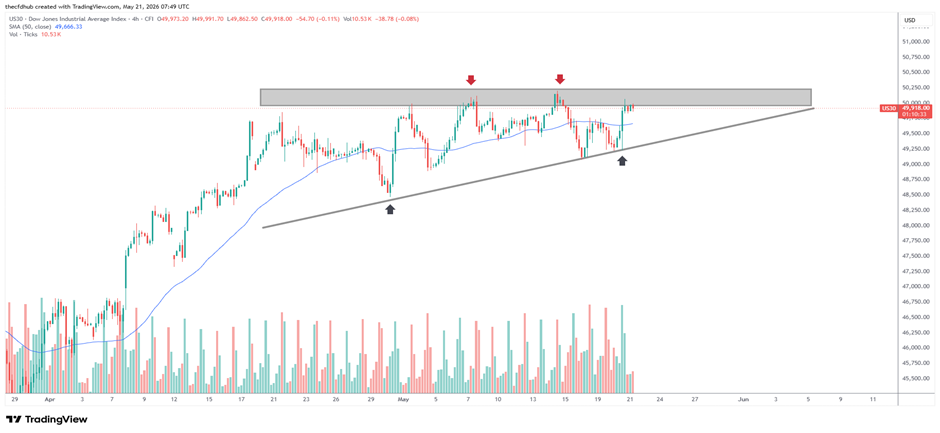 Figure: USD30, Time frame: 4H, Tools: SMA50, Source: Tradingview
Price Action
The main horizontal supply zone is located directly at the psychological 50,000 level. The index has tested this structural barrier twice during May, facing strong selling pressure on both occasions during intraday trading. Meanwhile, the 50-day Simple Moving Average continues to rise toward price action, providing additional dynamic support around the 49,670 level.
Ascending Support Line:
Meanwhile, buyers continue to enter the market at progressively higher levels, leading to the formation of a clear ascending trendline, as illustrated on the chart through the trendline and arrows.
Price action is currently moving within a narrow range between the dynamic support represented by the ascending trendline and the fixed supply zone at 50,000. Such movements often indicate heavy institutional accumulation ahead of a strong breakout in either direction.
Fundamental Outlook
The Dow Jones index drew support over the past week from strong earnings results that exceeded expectations among major industrial and financial companies. In addition, the integration of artificial intelligence solutions has enhanced logistics efficiency, while strong corporate balance sheets have helped reduce pressure on profit margins.
Bond Yields and Inflation:
On the other hand, persistent domestic inflationary pressures continue to limit bullish market momentum. The Consumer Price Index (CPI) remained relatively elevated at 3.8%, driven by energy supply bottlenecks resulting from tensions in the Middle. This environment is pushing the Federal Reserve to maintain its restrictive monetary policy stance, limiting valuation growth and keeping the market under noticeable pressure near the 50,000 supply zone.
-1782382125.webp)

-1782126200.webp)
-1724934015.webp)
-1782120433.webp)