


-1782120433.webp)
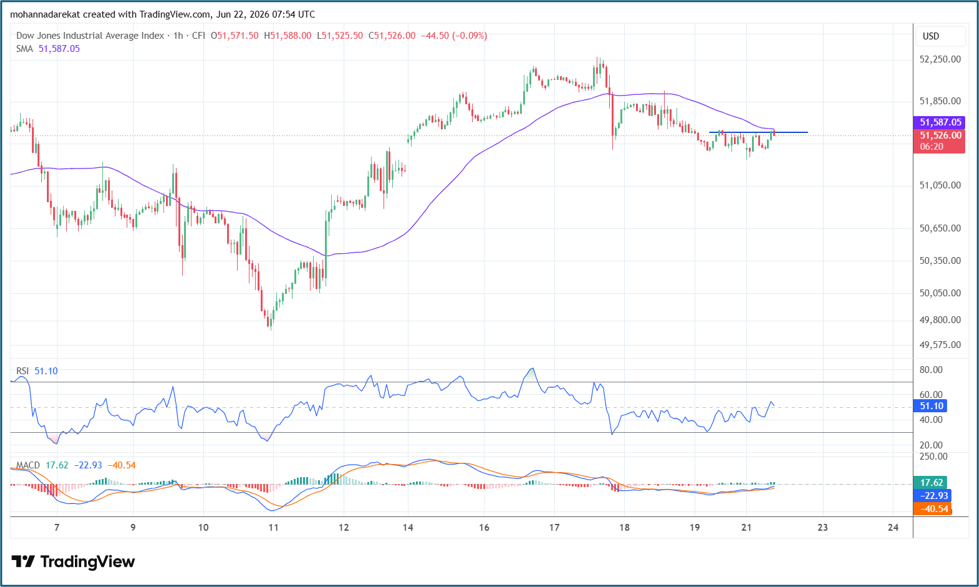 Tools: Dow Jones, TIME FRAME: 1HR chart , Tools: SMA 50
The attached chart highlights the importance of the 51,600 level as a key resistance area for the Dow Jones Index on shorter timeframes. This level represents the neckline resistance of a head and shoulders reversal pattern and also coincides with the resistance of the 50-period moving average. Therefore, a breakout above this area could support further bullish momentum toward the 51,800 level at a minimum according to technical analysts.
Global markets are awaiting a series of important economic releases this week, including the final reading of the US Gross Domestic Product (GDP) for the first quarter, which is expected to show growth of 1.6%, compared with 0.5% in the fourth quarter of last year. Investors are also looking forward to the release of the Core Personal Consumption Expenditures (Core PCE) Price Index, the Federal Reserve's preferred measure of inflation, which is expected to rise slightly to 0.3% from 0.2% in the previous reading.
-1782382125.webp)
-1782126200.webp)
-1724934015.webp)
-1781681220.webp)