· AI-driven giants are steering the Nasdaq’s direction
· The index consolidates between 24,015 support and 26,213 resistance
· Capital spending, margins, and key Fibonacci levels could shape the next move
How much of the Nasdaq’s strength is real growth, and how much is AI optimism? As companies pour billions into artificial intelligence, the index moves not just on profits, but also on confidence in future returns. AI has become the defining narrative behind Nasdaq performance. It influences earnings expectations, capital expenditure decisions, and valuation multiples.

The Fundamental Engine Behind the NASDAQ100 Index
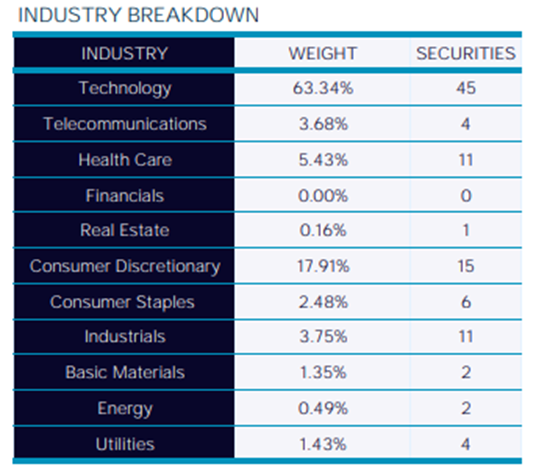
The Nasdaq-100 (US100) is heavily weighted by a group of mega-cap technology companies (Figure 1). Names such as NVIDIA, Microsoft, Apple, Amazon, Alphabet, Meta, and Google collectively represent a significant portion of the index. Many of these companies play a key role in the artificial intelligence ecosystem, whether by producing advanced chips, operating cloud platforms, expanding data centers, or developing AI-powered software.
Because these firms account for a large share of the index, their performance has a disproportionate impact on overall movement. The Nasdaq does not require broad participation from all components to rise or fall. A sharp rally or decline in one major stock can significantly influence the entire index.
For example, when NVIDIA reports rising revenue, it signals that demand for AI computing power remains strong. Investors often interpret this as a positive sign for cloud providers such as Microsoft and Amazon, since businesses depend on their infrastructure to deploy AI systems. That optimism can then extend to software and digital platforms integrating AI tools into their services. In this way, developments in one segment of the AI supply chain can influence sentiment and price action across the broader Nasdaq.
However, the same dynamic works in reverse. If a leading AI company signals slowing growth, margin pressure, or weaker forward guidance, investors may reassess the broader AI outlook. Given the index’s concentration, that reassessment can quickly translate into broader market volatility.
Why Capital Expenditure is a Critical Variable
As per analyst analysis, AI is infrastructure-heavy. Unlike traditional software development, AI requires substantial physical investment, advanced chips, data centers, cooling systems, and energy capacity. This spending is known as capital expenditure (CapEx). High capital expenditures directly affect two important financial measures: free cash flow and operating margins.
Free cash flow is the cash a company has left after covering operating expenses and capital spending. When CapEx rises sharply, free cash flow falls in the short term. That leaves companies with less cash available for share buybacks, dividends, or strengthening their balance sheets. This is not automatically negative, but it increases the importance of future returns, justifying today’s spending.
CapEx can also pressure operating margins, which measure how efficiently a company turns revenue into operating profit. While infrastructure investments are recorded over time, the related costs, such as energy, maintenance, and depreciation, increase operating expenses. If revenue does not grow faster than these costs, profit margins can decline.
The key issue, therefore, is not whether companies are investing, but whether that investment generates scalable revenue and long-term efficiency gains. If AI spending leads to accelerating earnings and stronger margins over time, valuations may remain supported. If spending remains elevated while revenue growth stabilizes, valuation pressure can emerge.
In a concentrated index such as the Nasdaq, where several dominant components allocate substantial resources to AI expansion, capital discipline is essential to sustaining market confidence.
Technical Analysis of Nasdaq100 Performance for 2026: Interpreting Nasdaq’s Price Structure
On the weekly timeframe, the Nasdaq is currently trading within a defined range, fluctuating between approximately 24,015 and 26,213, with 24,015 as support and 26,213 as resistance (Figure 2). Rather than trending decisively higher or lower, price action reflects consolidation, suggesting the market is reassessing valuations and AI-driven expectations.
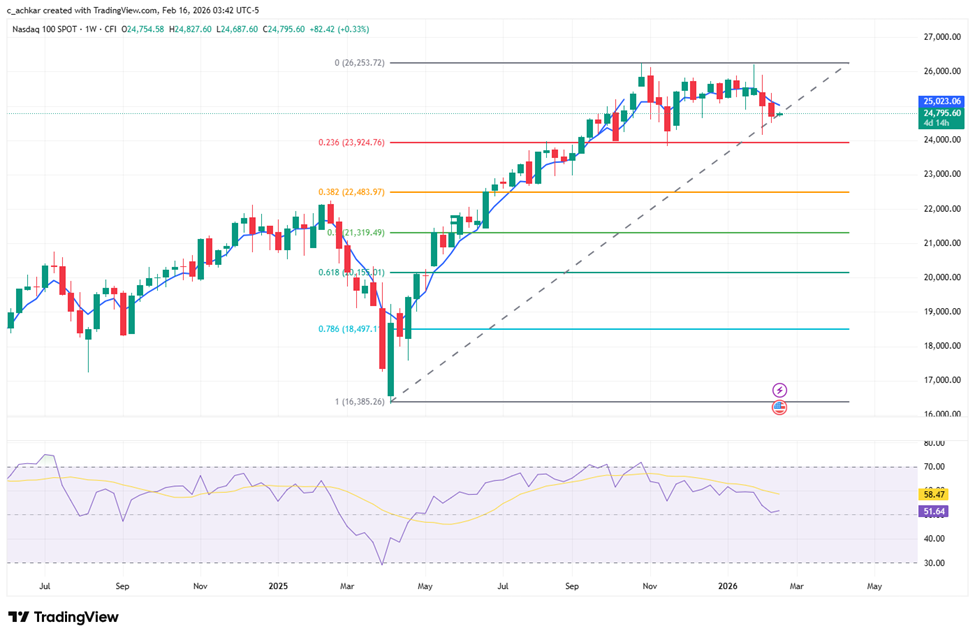
Within this structure, the 0.236 Fibonacci retracement level becomes a key technical reference. A decisive break below this level could signal weakening bullish momentum and increase the probability of a deeper move toward the lower boundary of the range. Such a move may align with growing concerns around AI spending efficiency or margin pressure.
Conversely, if price holds above the 0.236 level and stabilizes, it suggests that buyers remain active, keeping the broader structure intact and potentially supporting a retest of resistance near 26,213.
Momentum analysis through RSI provides additional confirmation. If RSI remains above 50, it suggests underlying strength despite consolidation. A drop below 50, especially with lower highs forming, may indicate fading momentum and rising downside risk.
When technical signals align with fundamental developments, moves tend to gain strength. For example, a break below Fibonacci support, accompanied by a weakening RSI and cautious AI-related earnings guidance, would reinforce downside risk. On the other hand, strong earnings from major AI-linked companies, combined with RSI stabilization and price holding key support, could support a renewed push toward resistance.
Conclusion
Nasdaq currently sits at the intersection of expectation and execution. AI continues to drive growth projections and capital investment, but technical consolidation suggests that the market is awaiting confirmation. In this context, both fundamentals and technical structure must align because, in a concentrated growth index such as the Nasdaq, confidence can shift quickly.