





-1787747020.webp)
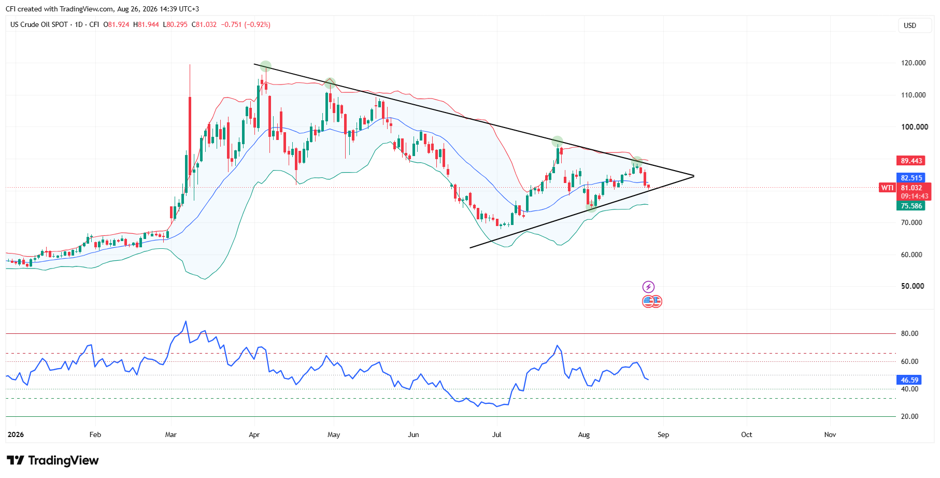 WTI, Time frame: 1D, Source: TradingView
Crude oil is trading within a symmetrical triangle, formed by a series of lower highs from the April peak and higher lows from the July bottom. The converging trendlines show a market moving into compression, with price action becoming increasingly constrained.
Price Testing the trendline support
WTI is currently trading around $80.90, positioning price very close to the triangle compression point. With both support and resistance converging, the market appears to be approaching a key decision point where the current consolidation phase may end.
Bollinger Bands Reflect Reduced Volatility
The Bollinger Bands have narrowed considerably compared to earlier in the year, highlighting a decline in volatility as the triangle matures.
Upper Band: $89.44
Mid-Band (20-period average): $82.50
Lower Band: $75.57
Price is currently trading below the mid-band, suggesting momentum has softened during the latest pullback.
Resistance Trendline Continues to Cap Bulls
The descending trendline from the March highs remains intact and has consistently limited upside progress throughout the consolidation. Recent rallies have struggled to establish acceptance above this dynamic resistance level.
Neutral RSI
The RSI is currently around 46, sitting below the neutral 50 level but comfortably above oversold territory. This reflects balanced market conditions, with neither buyers nor sellers showing decisive control.
Structure Remains Balanced
The triangle formation highlights a market that has been gradually transitioning from trend to consolidation. Recent swings have become smaller, while price continues to respect both boundaries of the pattern.
-1792060238.webp)


-1791969327.webp)
-1791796754.webp)
