-1782287857.webp)
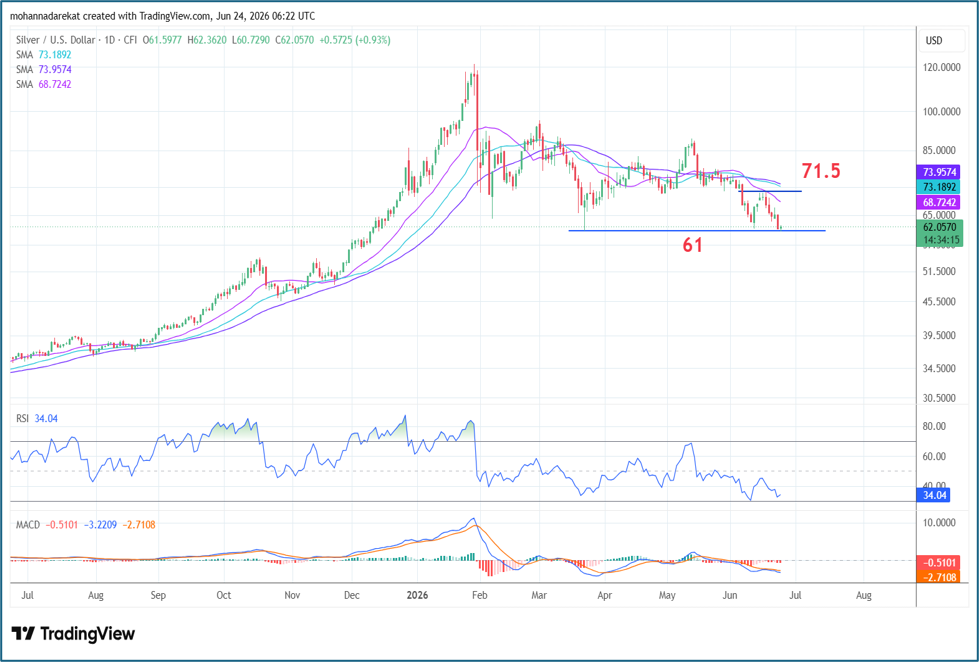 XAGUSD, Time frame: Daily, Tools: SMA20,35,50
TIME FRAME: Daily chart, Tools: SMA 20, 35, 50
Based on the attached chart, silver’s decline toward the $61 per ounce level represents an important test for price action in the coming period. This zone has previously acted as a key support and rebound area, where prices successfully stabilized on three separate occasions. Therefore, markets will closely monitor how price behaves around this level—whether it delivers another bullish rebound or breaks lower in search of a new base.
On the upside, levels near $71.5 represent a major resistance zone that must be breached to restore positive momentum. This area also coincides with the clustering of short- and medium-term moving averages, reinforcing its technical significance. Meanwhile, rising expectations of a Federal Reserve rate hike toward the end of the year, and the resulting strength in the US dollar to its highest level in a year, have added pressure on precious metals, particularly gold and silver, with silver already declining by around 17% since the beginning of the month.
-1781692372.webp)
-1724934015.webp)
-1780480761.webp)