





-1789633462.webp)
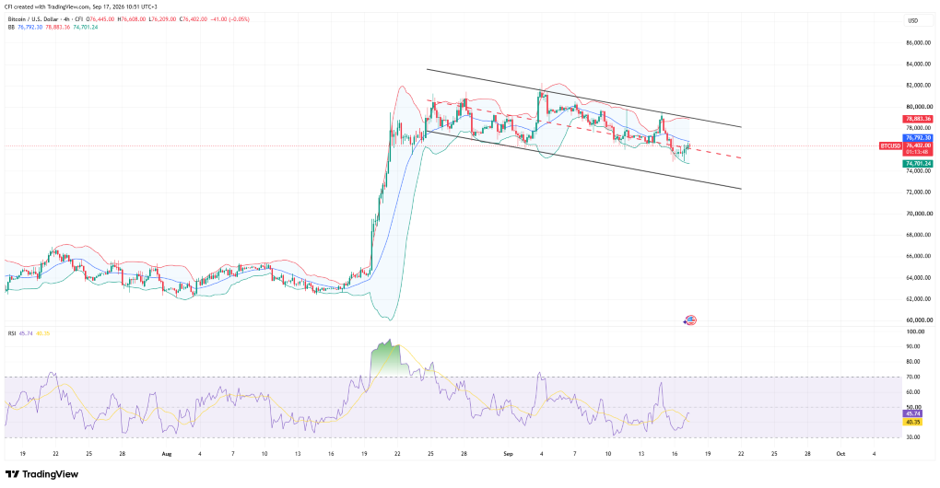 BTC/USD, Time frame: 4h, Source: TradingView
Bitcoin (BTC/USD) remains confined within a well-defined descending channel on the 4-hour chart, extending the sequence of lower highs and lower lows that began after the early-September peak near $82,000. Price action is currently stabilising near the middle of the structure, suggesting a period of consolidation rather than a decisive directional move.
Recent Bounce From Support
Bitcoin recently found support near the lower half of the channel and the lower Bollinger Band around $74,700. The subsequent rebound has lifted price back toward the middle of the range, but buyers have so far been unable to reclaim the descending trendline that continues to cap recovery attempts.
As a result, the recent move appears to be a stabilisation phase rather than confirmation that the corrective structure has ended.
Bollinger Bands
The Bollinger Bands have begun to contract, highlighting a decline in short-term volatility.
Upper Band: $78,884
20-Period Average: $76,793
Lower Band: $74,703
Price is currently fluctuating around the Bollinger basis near $76,793, indicating a lack of strong directional momentum. The upper band aligns closely with channel resistance, while the lower band marks the area where buyers recently returned to the market.
RSI Remains Below Neutral
The 4-hour RSI has recovered from recent lows and currently trades around 46.
Although momentum has improved from oversold conditions, the indicator remains below the neutral 50 threshold, suggesting bullish momentum remains limited. The recovery in RSI points to stabilisation within the correction rather than a confirmed shift back to an impulsive uptrend.
Key Levels to Watch
Resistance
$76,800–$77,000 (Bollinger basis area)
$78,800–$79,000 (upper Bollinger Band and channel resistance)
$82,000 (September swing high)
Support
$74,700 (lower Bollinger Band)
$73,000–$74,000 (channel support)
$72,000 (next major technical support)
-1787731465.webp)

-1787214523.webp)
-1724934015.webp)
-1786010911.webp)