





-1786968879.webp)
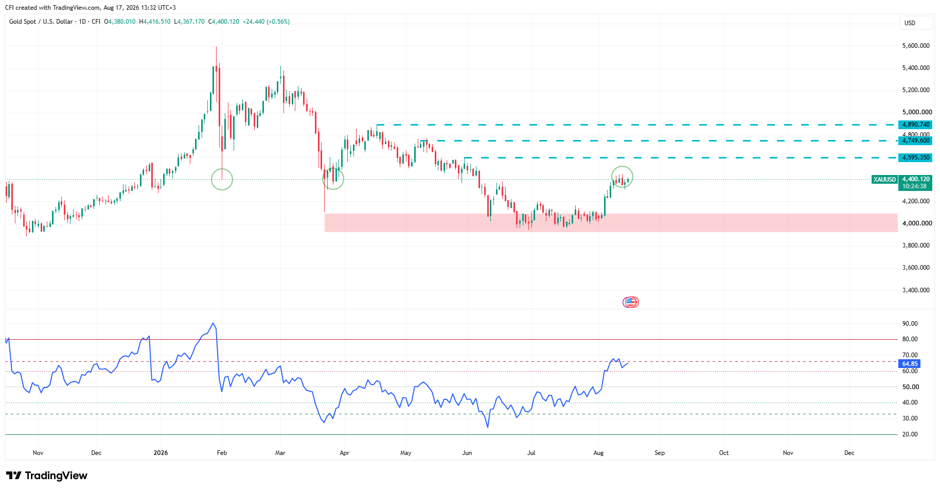 XAUUSD, Time frame: 1D, Source: TradingView
The gold price has experienced a strong upward move out of the 4,000-4,080-demand zone and is currently retesting the 4,390-4,400 range, which has proven to be an important level throughout 2026. The green circles indicate several reaction moves around this level. After forming support throughout July, buyers regained control in early August, producing a strong impulsive move higher. The rally lifted price back above previous swing lows and into an area that previously acted as support before the mid-year decline.
4,395 Becomes the Immediate Key Zone
Price is currently trading close to 4,394, directly at a historical reaction zone. Recent candles show consolidation rather than rejection, suggesting the market is assessing whether this level can be reclaimed as support. Key Resistance Levels Ahead
4,600 (first resistance area)
4,800 (secondary resistance zone)
4,891 (major resistance level and upper target area)
These levels correspond with previous swing points that emerged during the first-half decline. RSI Moves into Bullish Territory
The RSI is currently at 64.5, its highest reading in several months. Momentum has strengthened considerably since the July bottom, although the indicator remains below the overbought threshold at 70, suggesting the rally is strong but not yet stretched.
-1792504609.webp)


-1792406774.webp)
-1792060238.webp)