





-1789980568.webp)
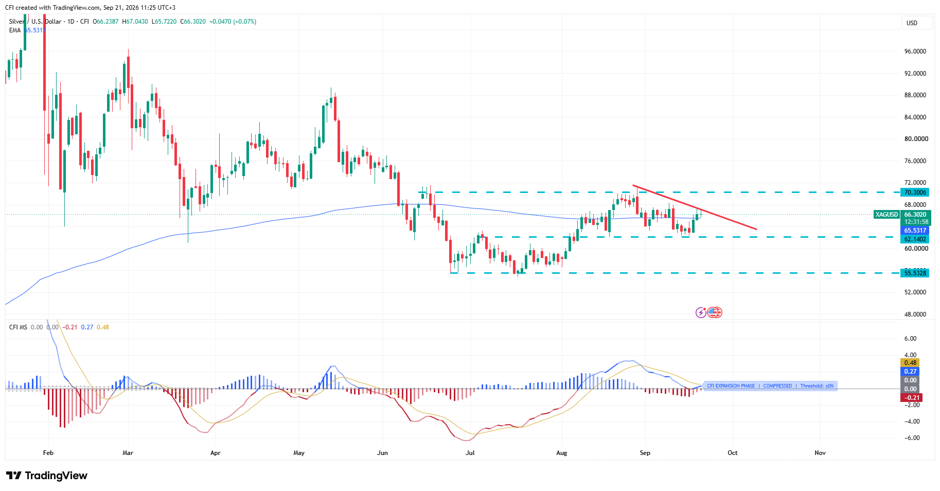 XAGUSD, Time frame: 1D
silver is currently trading within a broad range between 62.14 support and 70.30 resistance. Following the strong recovery from the July low near 55.53, price has stabilized in the middle of that range rather than extending into a new trend.
Descending Trendline
The dominant short-term feature remains the descending trendline drawn from the August highs. Recent rallies have repeatedly stalled beneath this trendline, preventing buyers from challenging the 70.30 resistance zone.
Price is currently attempting to push into that trendline again, making it the key level to watch.
200-Day EMA Provides Dynamic Support
The 200-day EMA at 65.53 sits directly beneath current price and continues to provide support during pullbacks.
Recent declines have repeatedly found buyers around this moving average, highlighting its importance as a longer-term trend gauge. As long as Silver holds above the 200-day EMA, the broader recovery from the July lows remains constructive.
70.30 Remains the Key Ceiling
The 70.30 level continues to define the top of the current range. Multiple tests of this area have attracted sellers, confirming it as a major supply zone and the primary barrier standing in the way of a larger bullish expansion.
Momentum Stabilising
The momentum indicator in the lower panel has started to flatten near the zero line after weakening through September.
This suggests downside momentum is easing, although buyers have not yet generated enough strength to force a breakout above trendline resistance.
-1792060238.webp)


-1791969327.webp)
-1791876866.webp)