





-1788866884.webp)
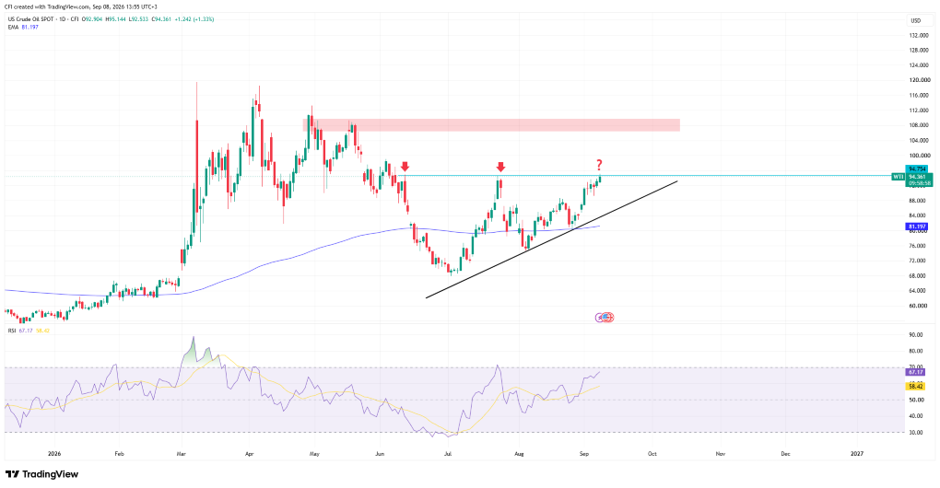 U.S. Oil (WTI), Time frame: 1D
WTI crude oil continues to trend higher from the July lows, with the price forming a clear sequence of higher highs and higher lows. The rising trendline drawn from the July bottom remains intact and has consistently supported the recovery over the past two months.
200-Day EMA Providing Dynamic Support
A key feature of the chart is the 200-day EMA at 81.20, which sits comfortably below the current price.
WTI has been trading above the 200-day EMA since reclaiming it in July, and the average has started to slope higher. This suggests the broader trend has shifted from neutral to positive, with the EMA acting as dynamic support during pullbacks.
Price Revisits a Familiar Resistance Zone
Current price is testing the $94-$95 region, an area that has repeatedly rejected advances since June.
The chart highlights two prior reversals from this zone, where rallies stalled before sellers regained control. The latest advance has brought price back into this resistance cluster for a third test.
Trendline Support Continues to Hold
While resistance remains overhead, the rising trendline continues to provide a solid foundation beneath price. Recent pullbacks have consistently found support above both the trendline and the 200-day EMA, reinforcing the constructive nature of the current structure.
RSI Reflects Strong Momentum
The RSI is currently around 67.2, remaining above its signal line (58.4) and approaching overbought territory.
Momentum has strengthened noticeably during the latest advance, highlighting growing bullish participation as WTI challenges overhead resistance.
-1790754997.webp)



-1789980568.webp)