





-1792144083.webp)
Dow Jones Technical Analysis
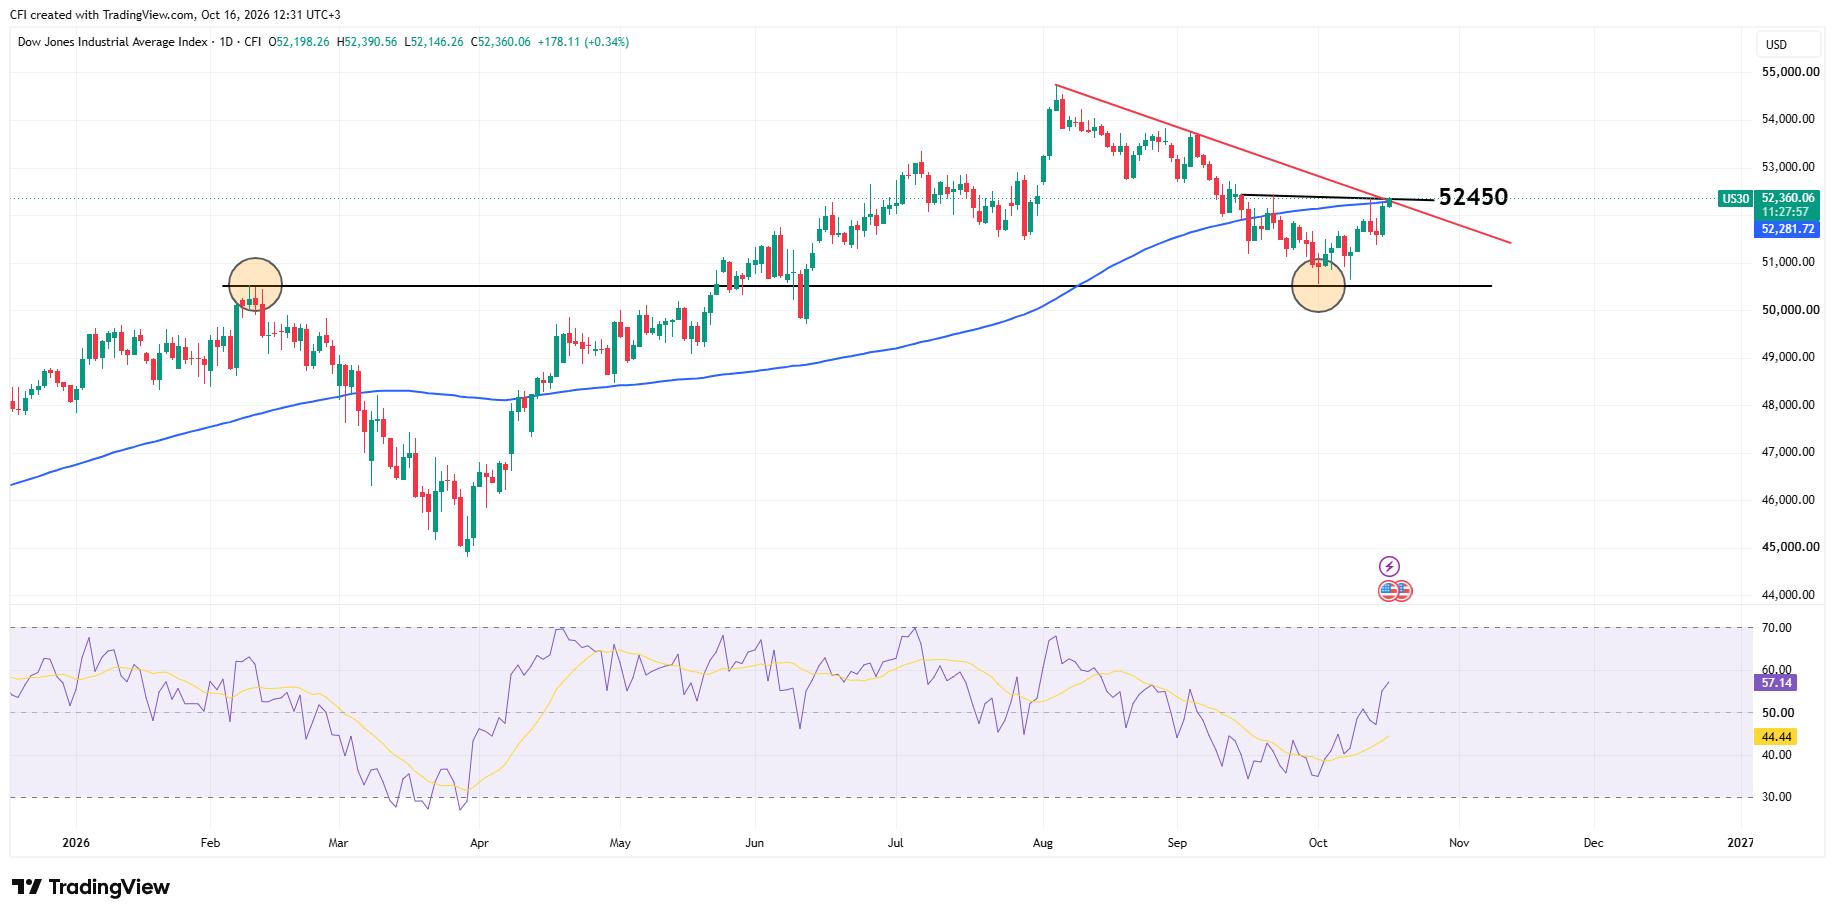 Figure: US30, D, Trading View
The Dow Jones rose 1.1% in Thursday’s session, marking its biggest daily gain since early August and closing near 52,180. It has extended those gains so far today and is now testing the key resistance area around 52,450, which is significant for the following reasons:
- It marks resistance at the 100-day simple moving average.
- It aligns with a resistance line that the index has attempted to break twice before.
- Most importantly, it represents resistance for a potential head-and-shoulders pattern. A breakout would confirm the pattern and strengthen expectations of further upside.
Overall, a break above 52,450 could confirm a bullish chart pattern, pointing to further gains in the coming sessions.
Dow Jones Fundamental Analysis
The Dow Jones rose 1.1% yesterday as investors shifted toward companies with more attractive valuations outside the technology sector, which continued to decline. Lower government bond yields also boosted risk appetite, although inflation concerns limited gains.
Meanwhile, Fed Chair Kevin Warsh offered no indication of the upcoming interest rate decision, leaving expectations subject to change until the next meeting.
Can the Dow Jones maintain its upward momentum despite inflation fears, energy market disruptions and concerns surrounding the AI boom?
-1792060510.webp)




-1791281116.webp)