


Fundamental View of Gold Price:
Gold has continued its upward price trend since mid-August, driven by several factors reinforcing this bullish momentum. Investors are assessing the future of the U.S. Federal Reserve’s independence, along with uncertainty surrounding U.S. tariffs after a federal appeals court ruled that those tariffs were unlawful and exceeded the authority granted to former President Donald Trump. This comes ahead of the key U.S. jobs report due Friday. Also, an emergency hearing regarding Trump’s move to dismiss Federal Reserve Governor Lisa Cook ended Friday without a decision. A ruling on whether she can continue her role isn’t expected before Tuesday at the earliest.
Fed Independence, Tariff Rulings, and Their Impact on the Gold Price Forecast
This decision is likely to determine the future direction of the Federal Reserve. Concerns over a less independent monetary authority could erode investor confidence in the U.S. a scenario that may likely boost demand for safe-haven assets.
Lately, a federal appeals court ruled that Trump’s global tariffs were imposed unlawfully under emergency legislation, upholding a prior ruling by the U.S. Court of International Trade in May. However, the judges allowed the tariffs to remain in place while the case continues, hinting at the possibility of narrowing the scope of any future injunction.
________________________________________
Technical ِAnalysis of Gold:
Gold had surged to a record high of around $3,500 per ounce in April after Trump unveiled an initial plan to impose tariffs. Since then, gold has traded within a narrow range as safe-haven demand waned following Trump’s retreat from some of his more aggressive trade proposals.
Monthly Chart Analysis of XAUUSD
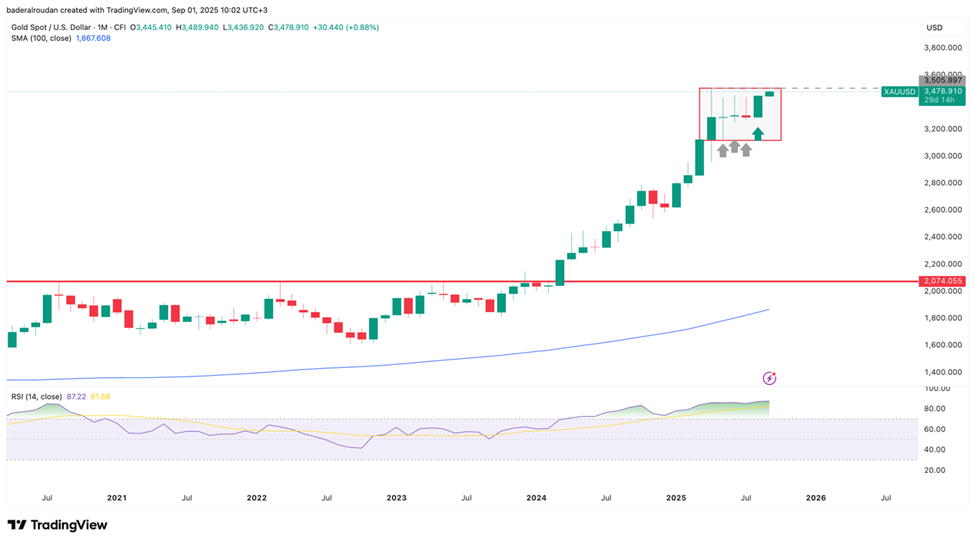
Gold decisively broke its 3-year horizontal resistance at the $2,080 level (marked by the red line) during early 2024, initiating a sustained bullish trend. By April 2025, it had printed a new All-Time High (ATH) at $3,500. Following this peak, gold entered a 3-month consolidation phase, trading within a well defined range between $3,250 and $3,450.
This sideways movement is visually captured by three consecutive indecision candles specifically, Doji formations, as highlighted within the red box area on the chart, with grey arrows marking each monthly candle. This period represented a temporary equilibrium between buyers and sellers.
However, in August 2025, a decisive bullish breakout occurred. Gold closed the month with a strong bullish candle, fully engulfing prior indecision and signaling renewed buying momentum and a potential continuation of the uptrend.
Weekly Chart Analysis of XAUUSD:
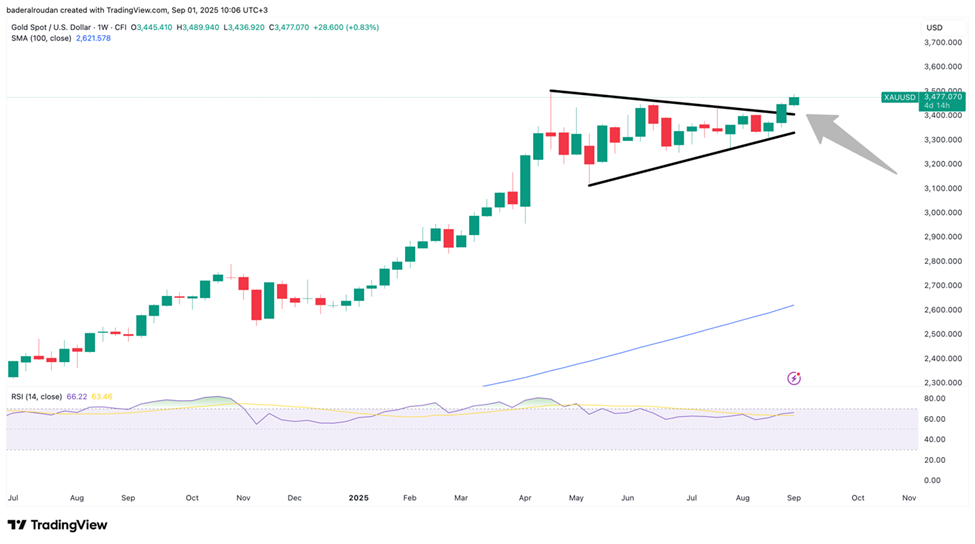
On the weekly timeframe, gold has exhibited tightening price action, compressing to weekly ranges as narrow as $150. This compression phase culminated in a clean breakout, as shown by a bullish weekly candle that closed above the key (black resistance trendline), confirming breakout strength.
This week’s printed another bullish candle, breaking above the previous week’s high (indicated by a grey arrow), reinforcing continued bullish pressure and trend continuation.
4-Hour Chart Technical Analysis of XAUUSD:
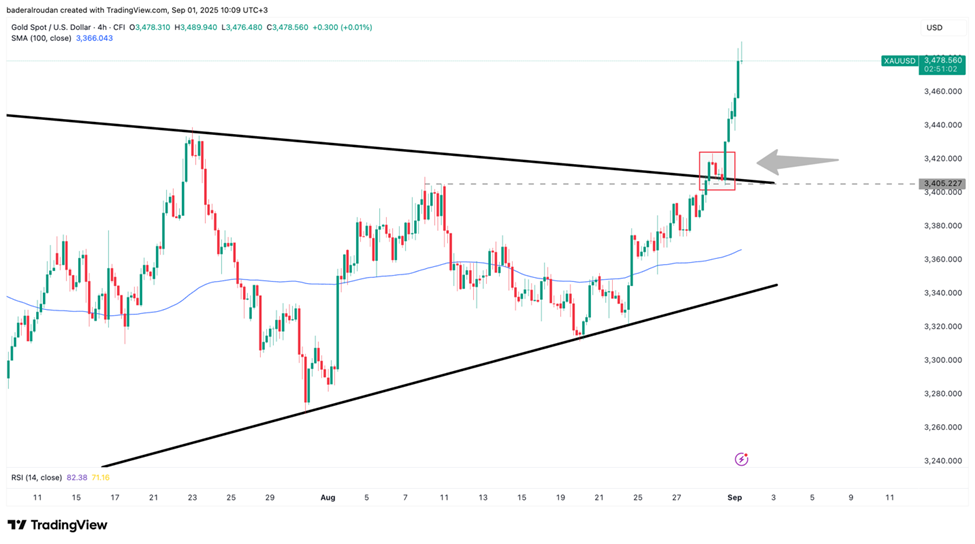
Zooming into the 4H chart, we observe a well-structured breakout (highlighted in the red box) above the $3,400 key swing high, with price pushing past $3,410 resistance (black line).
Clearly, gold successfully retested the breakout zone around $3,405, establishing the breakout’s validity and providing a textbook example of breakout-retest-continuation price structure.
-1784202577.webp)

-1783942758.webp)

-1783413240.webp)