Last week, the markets showed that behind every headline lies a deeper story, one told through price action rather than just a press release.
For instance, on May 21, 2025, major U.S. indices experienced a notable decline. The Dow Jones (US30) fell by about 2%, the Nasdaq declined by approximately 1.31%, and the S&P 500 (US500) dropped by around 1.60%. This was attributed to rising borrowing costs, concerns about U.S. debt, weak corporate results, and global uncertainty. While these headlines are attention-grabbing, if you have been reading charts rather than just the news, the signs were already there.
From a charting perspective, this was not particularly surprising. All three indices were near critical resistance zones after a strong run-up: the Dow Jones (US30) was testing the approximately 42,880 resistance level (Figure 1), the Nasdaq (US100) was testing the approximately 21,488 resistance level (Figure 2), and the S&P500 (US500) was testing the approximately 5.970 resistance level (Figure 3). With nothing new to push prices higher and sentiment turning cautious, a correction was waiting to happen.
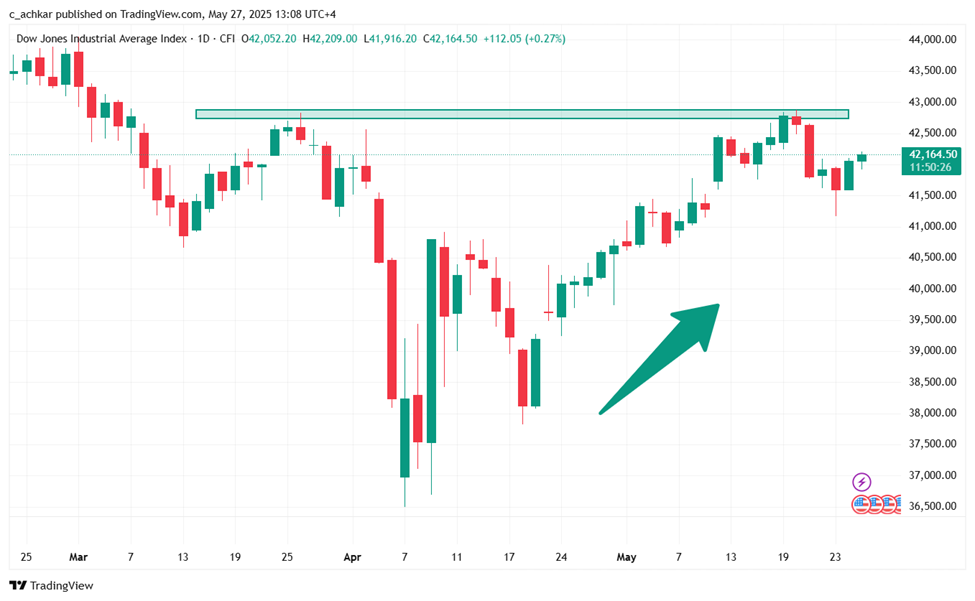
Figure 1: Dow Jones (US30), Daily Time Frame, Trading View
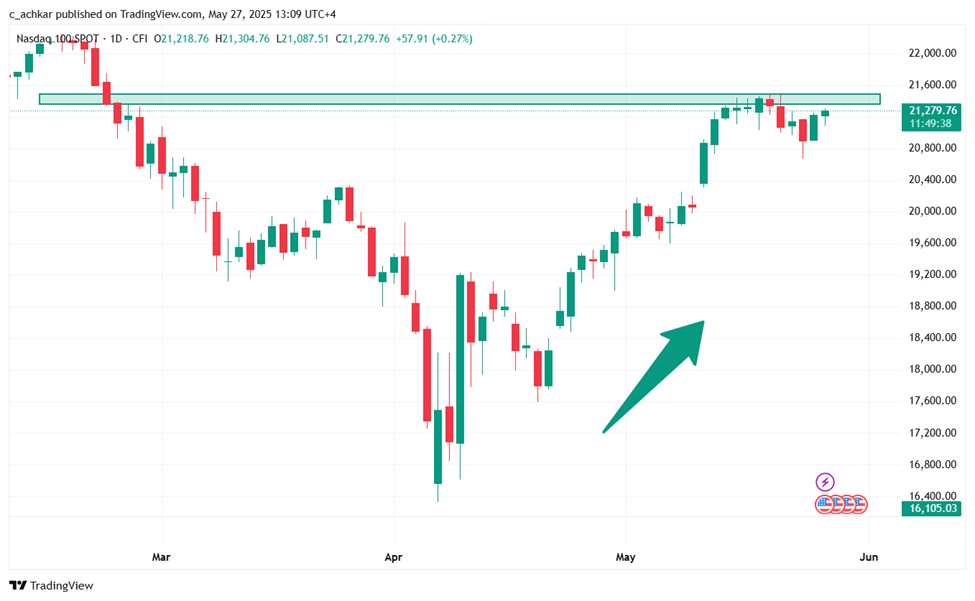
Figure 2: Nasdaq (US100), Daily Time Frame, Trading View
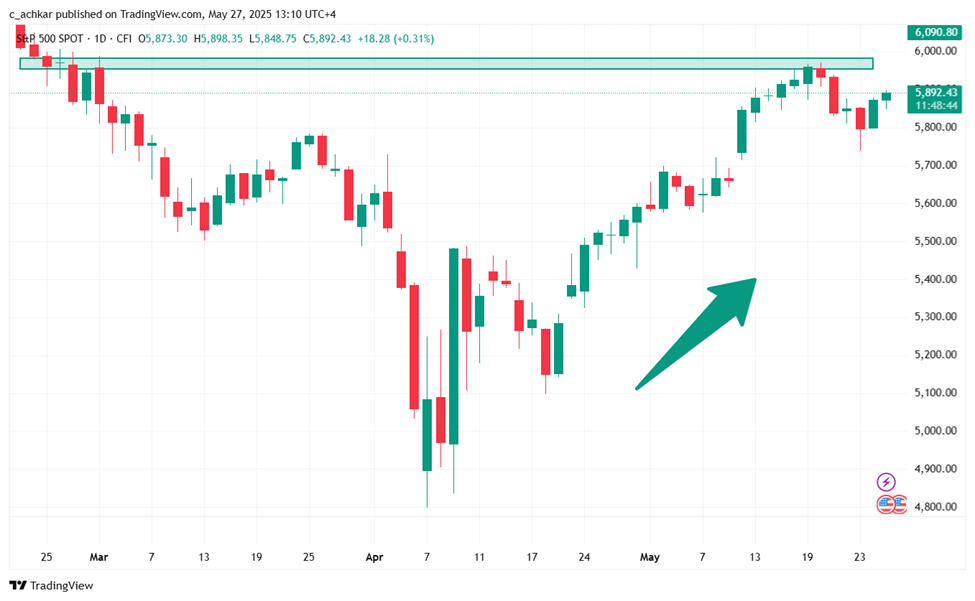
Figure 3: S&P500 (US500), Daily Time Frame, Trading View tutorial
What is interesting is that the recent drop across major indices isn’t just about one piece of news. It reflects a bigger picture shaped by how investors were already positioned, how sentiment was shifting, and how the market behaved well before the news broke.
A lot of what happens in the market doesn’t always show up in the headlines. It appears in the price action. That’s where technical analysis comes in; it’s like a secret language. It’s subtle, it doesn’t shout, and not everyone takes the time to understand it. But for those who do, it provides an advantage by revealing what’s building under the surface.
In the past few days, signs were already there: The S&P500 (US500) struggled to hold above key levels, the Nasdaq (US100) started to lose momentum, and the Dow Jones (US30) failed to push higher.
None of these signals guaranteed a drop, but they did act as clues. When the news finally hit, it did not create the move; it confirmed what was already unfolding. The headlines made noise, but the charts told the story first.
The next time you encounter a flashy headline, remember that the market often communicates in a different language, one expressed through price action, not just news alerts. While the news can explain what just happened, charts can offer clues about what traders expected or how they are reacting. Learning to spot simple things like using support and resistance levels in trading or trend direction can reveal insights that headlines alone might miss. It’s not about ignoring the news, but about complementing it with context. In conclusion, understanding both can give a fuller picture of what’s really moving the markets.
-1760529242.webp)