

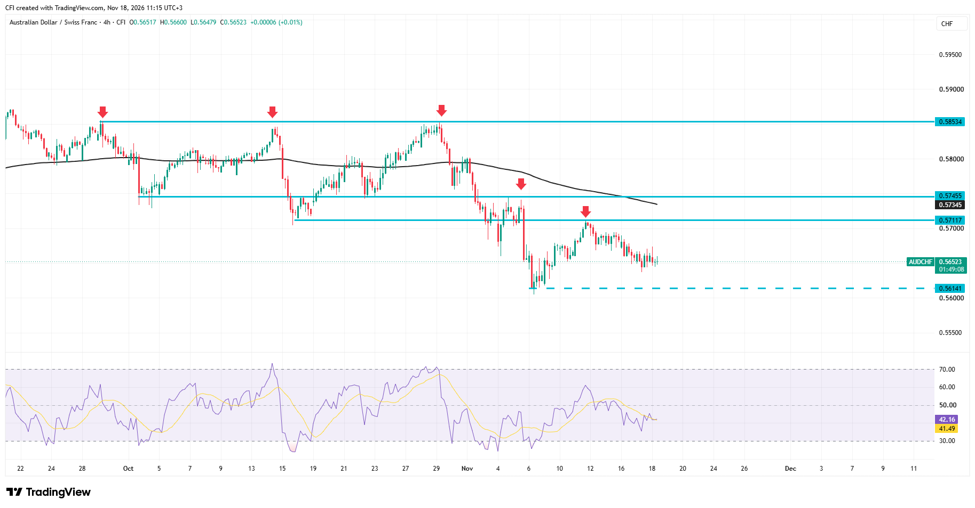
 AUDCHF, Time frame: 4H, Source: Tradingview
From late September to late October, AUD/CHF traded in a well-defined range, with a floor at roughly 0.5712 to 0.5746 and a ceiling at 0.5853. Price tested the ceiling three times without breaking it, forming what is often called a triple top, while bulls kept stepping in at the floor.
Price broke below the floor in early November and dropped to 0.5614. It has stayed below the old range since then. The pair now trades around 0.5655, between the former floor above and the November low below.
Resistance: the 200 EMA
The zone that supported price through October has turned into resistance. Price was rejected near 0.5745 on 5 November and near 0.5712 on 12 November, a series of lower highs. A broken support level that holds when retested from below is commonly read as confirming the breakdown.
The 200-period EMA, now near 0.5735, sits inside this zone. It flattened through October and turned lower at the start of November, and price has stayed below it since. That puts the moving average and both recent rejections in the same band.
Support:
0.5614 is the 6 November low, where bulls drove the rebound toward 0.5712. It has been tested once. The current pullback hasn’t reached it yet, and price has held just above 0.5640 in recent sessions.
A second test would show whether bulls are still active there. A sustained break below it would extend the run of lower lows that started with the early November breakdown.
RSI
The RSI is around 44. That is slightly above its signal line near 42 but below the 50 midline. It has eased from around 60 at the 12 November high, in line with the pullback in price. That reads as neutral to slightly soft momentum, with neither side stretched.