


-1779106034.webp)
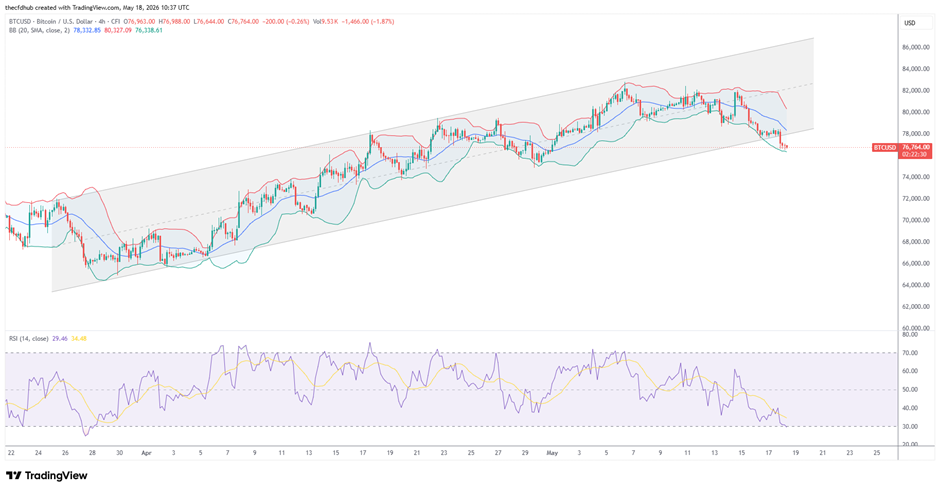 BTC/USD, Source: Tradingview
Bitcoin (BTC/USD) is trading around $76,889, experiencing a sharp 6% weekly correction. The market has shifted from a period of institutional consolidation to a more defensive stance as a resurgence of geopolitical tensions and inflation fears triggers a broad exit from risk assets. The price has pierced the lower Bollinger Band ($77,341). In technical terms, trading outside or touching the lower band suggests that the asset is becoming statistically oversold relative to its 20-day moving average.
Band Expansion: The Bollinger Bands are beginning to expand significantly. This widening indicates a surge in volatility and confirms that the previous tight consolidation phase has resolved into a bearish directional move. Mean Reversion Potential: Historically, deep touches of the lower band often lead to a "snap-back" toward the 20-day SMA ($80,147). However, in high-volatility environments, price can "walk down the bands" if the fundamental pressure remains extreme.
RSI at 29.09 with a signal line at 34.46 marks the first sub-30 print on the 4H chart since the March recovery lows, when BTC was trading around $68,000. On every prior occasion during the channel rally that RSI approached the 30 level, the price was at or near the channel's lower trendline and produced a bounce. The difference this time: the channel is broken. The most common retail mistake at oversold RSI readings is treating them as automatic buy signals. On the 4H chart, RSI below 30 in a trending environment means momentum is extreme; it does not mean price must reverse immediately.
-1783517806.webp)
-1782123055.webp)
-1780574561.webp)
-1724934015.webp)