


-1780396849.webp)
 BTCUSD, Tools: SMA100, Time frame: Daily
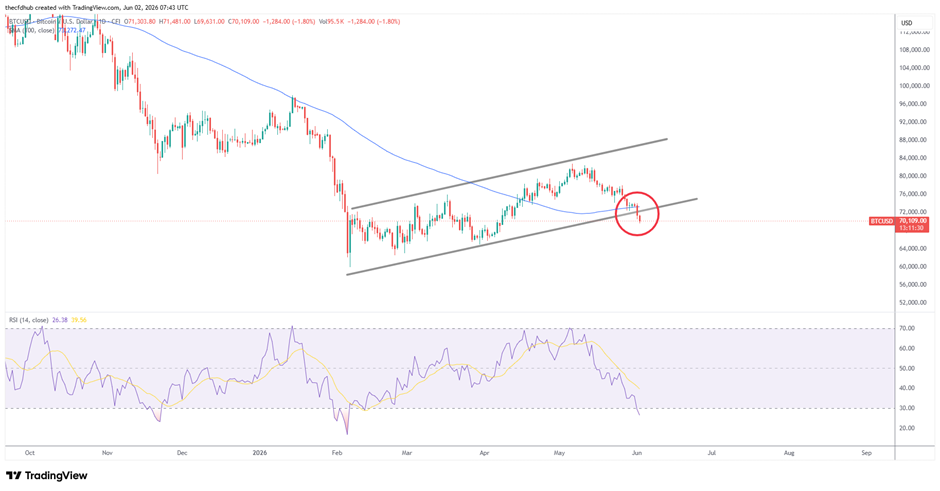
Bitcoin (BTCUSD) has been trading within an ascending channel since its sharp recovery from the February lows. This structure reflects a gradual transition from the previous downtrend into a corrective bullish phase.
Trendline Support in Focus
Recent price action shows BTC pulling back sharply toward the lower boundary of the ascending channel, highlighted by the red circle. Price is now approaching a key structural support area where buyers have previously stepped in.
Moving Average Acting as Dynamic Resistance
The 100-day moving average continues to slope downward above the current price, while recent candles have failed to reclaim this level. This suggests that the moving average is acting as dynamic resistance and reflects weakening short-term bullish momentum.
Lower High Formation Signals Weakness
Bitcoin recently formed a lower high in the $80,000–$82,000 region, followed by a sustained decline. This shift in market structure points to diminishing buying pressure within the channel.
Momentum Turning Bearish
The RSI is trending lower toward the 20–30 range, indicating increasing bearish momentum and approaching oversold conditions. This aligns with the current downward price movement and suggests that sellers remain in control in the near term
-1783517806.webp)
-1782123055.webp)
-1780574561.webp)
-1724934015.webp)