





-1786010911.webp)
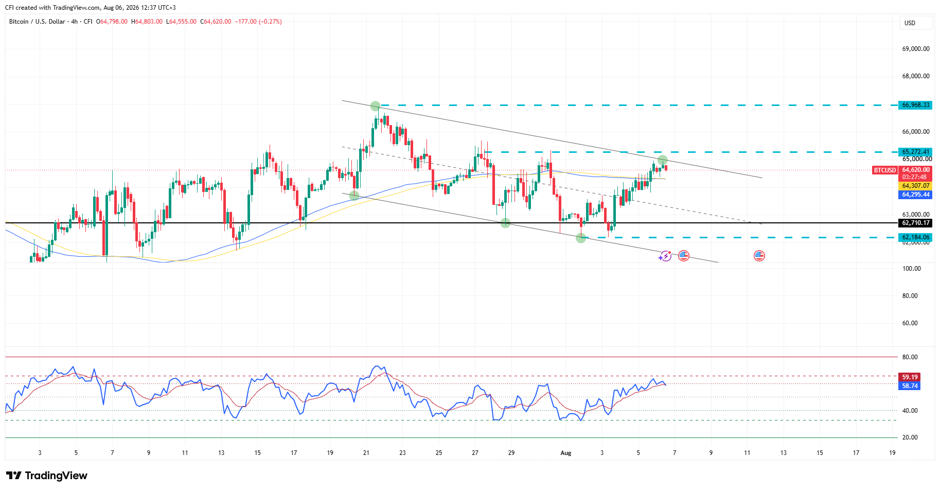 BTCUSD, Time frame: 4H, Source: TradingView
BTC has been consolidating inside a descending channel since topping out near $66,968 on July 21. The channel is well-defined by two parallel trendlines connecting lower highs and higher lows, with price currently pressing against the upper trendline of the channel, a key decision point. The latest move places BTC at a critical technical junction, with buyers attempting to challenge a major resistance.
100-SMA Supports the Recovery
The 100-period SMA, currently positioned around $64,300, has shifted from resistance to support during the latest rebound. Bitcoin reclaimed the average following the bounce from the August lows and has continued to hold above it.
As long as price remains above the 100-SMA, the short-term recovery structure remains supported, with buyers maintaining control of the recent advance.
$62.7K Supports the Structure
On the downside, the $62,710 level remains the key support area. This zone sits just above the broader $62,184 range floor, where buyers previously stepped in to halt the decline.
The successful defense of this area created the foundation for the current rally and continues to define the lower support of the recent trading range.
Momentum Continues to Improve
The RSI is currently holding around 60.4, remaining above both the neutral 50 level and its signal line. Momentum has strengthened steadily since the early-August low and reflects improving buying pressure as Bitcoin approaches resistance.
-1789633462.webp)

-1787731465.webp)
-1787214523.webp)
-1724934015.webp)