-1787040380.webp)
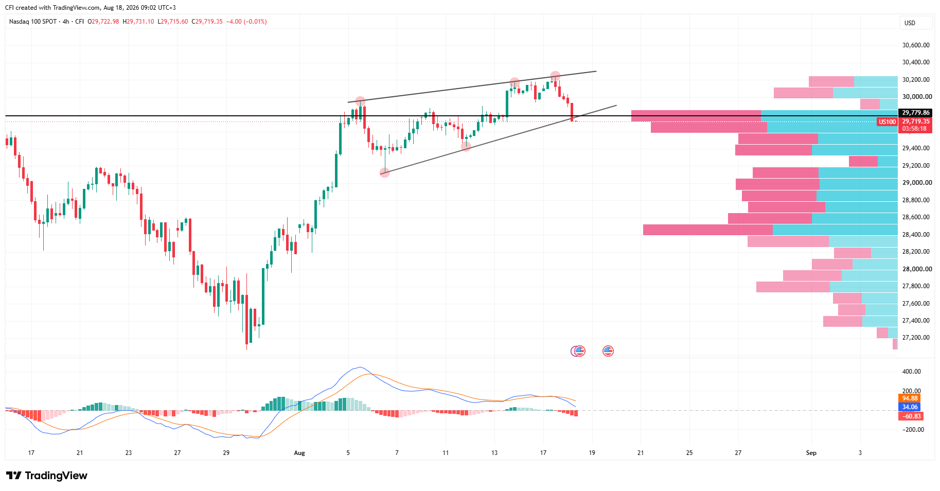 Nasdaq100. Time frame: 4H
The Nasdaq 100 continues to trade within a rising channel, with higher highs and higher lows defining the recovery from the late-July low. Recent selling pressure has pushed price back toward channel support, where buyers and sellers are now competing for control. While momentum has softened, the broader structure remains intact as long as the trendline continues to hold. POC and Trendline Form Support Confluence
The key level is 29,775, where the rising channel support intersects with the Point of Control (POC). This area represents the highest concentration of traded volume on the profile and is acting as a major support zone.
Price is testing both the trendline and the POC simultaneously, making this one of the most important areas on the chart.
Recent Rejection Came from Channel Resistance
The latest pullback developed after another rejection near the upper trendline of the channel around 30,100-30,200. This keeps the market contained within the rising structure while price rotates back toward support.
Volume Profile Supports Current Area
The highest volume concentration is between 29,600 and 29,900, indicating that the market remains within a major value area. Current price action reflects a retest of value rather than a confirmed breakdown. Momentum
MACD has rolled over from recent highs, with the histogram turning negative and the MACD line crossing below the signal line. This reflects slowing upside momentum as price retests support.



-1791281116.webp)