





-1787819517.webp)
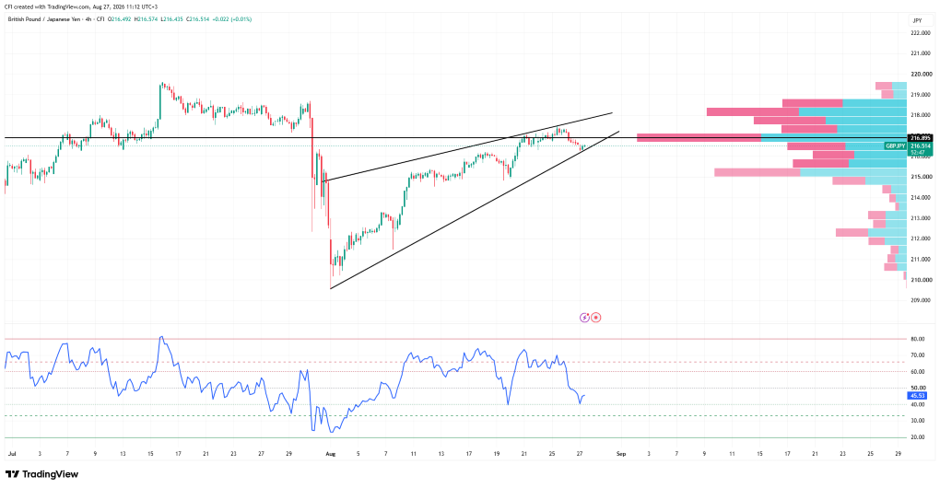 GBPUSD, Time frame: 4H, Source: TradingView
GBP/JPY remains within a short-term ascending triangle-like structure, with higher lows developing from the sharp August reversal low. However, recent price action has pulled back from resistance and is now testing the rising trendline that has supported the recovery over recent weeks.
POC acting as resistance
The 216.90–217.00 region remains a significant resistance area. Price has approached this zone multiple times during August but has struggled to establish acceptance above it. The latest rejection has triggered another move back toward support.
Trendline Support Under Pressure
The rising trendline connecting the August lows is now being tested near 216.40–216.50. This support level has repeatedly attracted buyers throughout the recovery and remains a key area for maintaining the current structure.
Volume Profile Highlights a Key Value Zone
The volume profile shows the largest concentration of trading activity around 216.80–217.00, placing current price just below a major value area. This suggests the market remains close to an important balance point where previous buying and selling activity was concentrated.
RSI Returns to Neutral Territory
The RSI has declined to approximately 46, slipping below the neutral 50 level after previously reaching overbought conditions above 70. This reflects a moderation in momentum rather than a decisive shift in trend.
Market Remains Between Support and Resistance
Price is currently caught between rising trendline support and horizontal resistance near 217.00. The narrowing space between these levels suggests the market is approaching a decision point after several weeks of consolidation
-1791446335.webp)


-1791368114.webp)
-1791359420.webp)
