





-1788773429.webp)
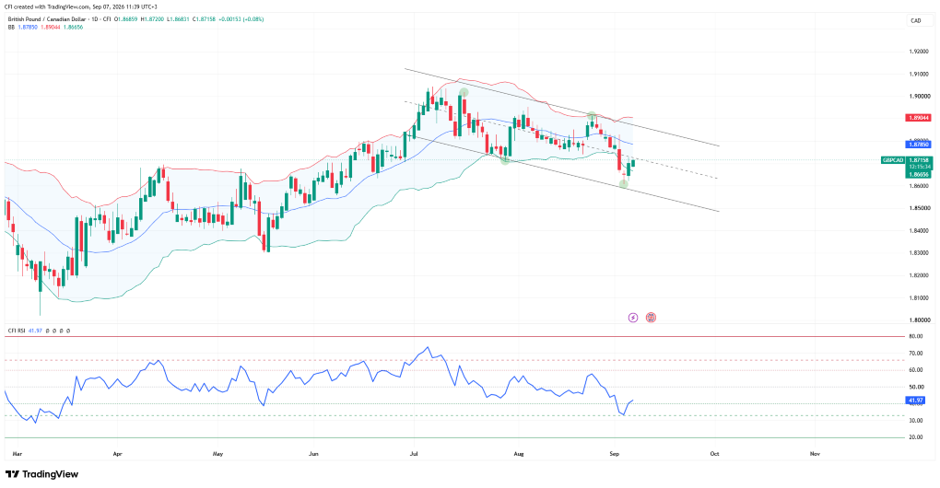 GBPCAD, Timeframe: 1D
GBPCAD has bounced from the lower trendline support of a well-defined descending channel, with buyers stepping in near the 1.8600 support zone. The pair remains within the broader bearish structure, but the latest rebound suggests downside momentum is beginning to fade after an extended decline from the July highs.
1.8600 Holding as Critical Support
The recent swing low around 1.8600 represents the most important support level on the chart. Price reacted strongly from this area, aligning closely with the lower channel support and highlighting it as a key zone where demand has repeatedly emerged.
Bollinger Band Midline Presents First Hurdle
The current recovery is approaching the 1.8780-1.8800 region, where the Bollinger Band midline is acting as immediate resistance. Price remains below this dynamic resistance, meaning bulls must reclaim this area to strengthen the case for a larger recovery toward channel resistance.
Descending Channel Continues to Define Trend
The pair remains confined within a downward-sloping channel that has guided price action since the July peak near 1.9000. Until price breaks above the upper trendline, the broader trend remains tilted to the downside despite recent buying interest.
RSI Rebounds From Near-Oversold Territory
RSI has recovered to approximately 42, rebounding from levels near the oversold zone. The improvement reflects a reduction in bearish momentum, although the indicator remains below the neutral 50 mark, suggesting sellers still hold the medium-term advantage.
1.8900 Resistance Zone Comes Into Focus
Should buyers secure a daily close above 1.8800, attention would shift toward the upper channel trendline around 1.8900-1.8950. This area has capped previous rallies and represents the next major test for any sustained bullish recovery.
-1791446335.webp)


-1791368114.webp)
-1791359420.webp)
