





-1783413496.webp)
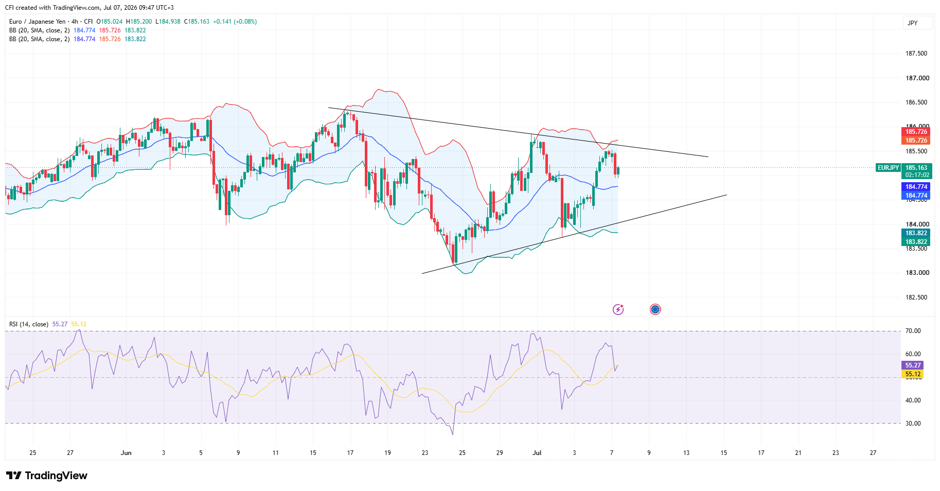 EURJPY, Time frame: 4H, Tool: SMA20, Source: Tradingview
EUR/JPY 4-hour chart is currently showcasing a classic volatility compression setup. After a period of aggressive swings, the price action has stalled, coiling tightly within a well-defined wedge pattern.
Higher Lows Building from June Bottom
Since finding support around 183.00, the pair has established a sequence of higher lows. This has created a short-term ascending structure, indicating improving momentum within the recent recovery phase.
Price Holding Above the Bollinger Basis
EURJPY is currently trading above the 20-period Bollinger Band basis, suggesting buyers retain near-term control. However, price remains below the upper Bollinger Band and trendline resistance, leaving the recovery unconfirmed.
Resistance Near 185.50
The descending trendline converges closely with the upper Bollinger Band around 185.70, creating a significant resistance zone overhead. This area has already attracted selling pressure during previous tests.
Momentum: RSI Neutral
The Relative Strength Index is currently hovering near 55, sitting just above the neutral 50 line. The RSI mirrors the price structure perfectly; it is neither overbought nor oversold, leaving plenty of runway for momentum to accelerate once a breakout occurs.
-1791446335.webp)


-1791368114.webp)
-1791359420.webp)
