


-1782989015.webp)
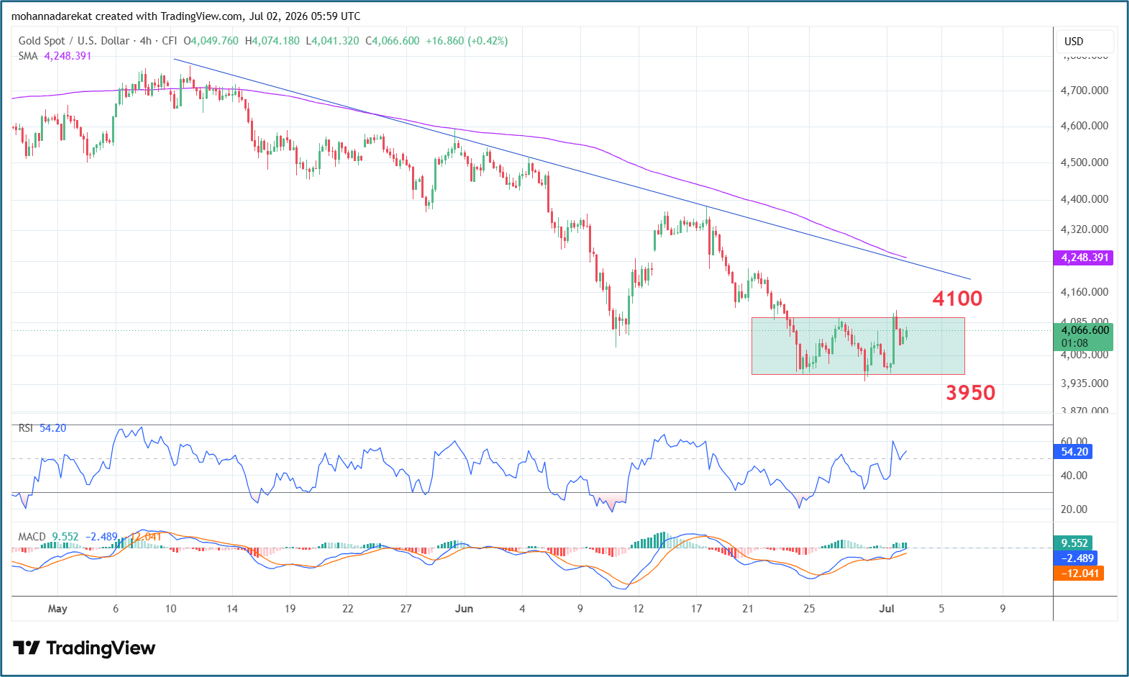
The attached chart shows that gold prices have entered a period of sideways consolidation following the downtrend that has dominated the medium- and long-term outlook. Gold is currently trading between a resistance zone around $4,100, which it attempted to break during yesterday's session, and a support zone near $3,950.
The chart also highlights a descending trendline acting as a major resistance around $4,250 per ounce. This level is reinforced by the 150-period moving average, making it a key technical resistance area.
Markets are now awaiting today's US employment data for further clues on the future path of US monetary policy, which is expected to influence gold's short-term direction. Although gold is widely regarded as a hedge against inflation, persistently high interest rates reduce its investment appeal, as the metal does not generate any yield.
Overall, based on the technical outlook shown in the chart, the broader trend is expected to remain bearish unless prices manage to break above the descending trendline resistance near $4,250 per ounce.
-1784545062.webp)

-1784202577.webp)
-1783942758.webp)