
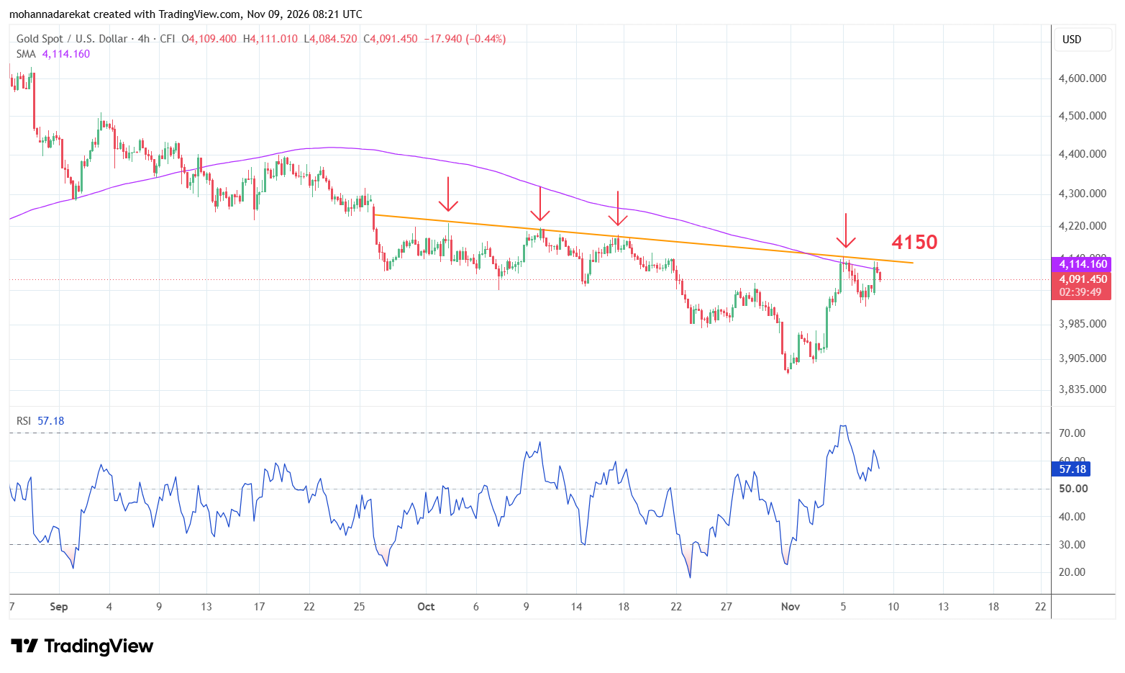
 XAUUSD, Time frame: 4H,
Technical analysis – gold
The accompanying chart highlights the significance of the price levels around $4,150 for gold's price movements. Despite gold rising by approximately 5% last week, the gain has not yet been sufficient to shift its momentum into positive territory. A closer look at the significance of the $4,150 level reveals the following:
- It represents an extension of a resistance zone that gold has attempted to break above on several previous occasions.
- It also represents the resistance level formed by the 200-period moving average.
- Finally, it marks the most recent peak recorded by gold at the end of last week's trading.
In conclusion, gold needs to break above the $4,150 resistance level to make further gains. However, unless it manages to do so, gold will remain under downward pressure.
Fundamental analysis – gold
The approximately 12% decline in oil prices last week helped ease inflation concerns, while markets are awaiting tomorrow's US inflation data amid expectations of a slowdown in inflation. Forecasts point to inflation slowing to 0.3%, compared with the previous reading of 0.6%. Meanwhile, the US Dollar Index is down approximately 0.4% in today's session, trading near the 101.8 level.
The question now is whether the inflation data forecasts and the decline in oil prices will help gold break above the $4,150 resistance level, or whether selling pressure will persist and gold will resume its decline.