


Those tracking gold and oil prices will clearly notice the significant volatility in price movements, which has reached historical levels. For instance, gold has declined by nearly 25% in less than two months, while oil prices have surged by around $100 per barrel since the beginning of the year. Prices are driven by market developments, with their direction influenced by how significant and sustained these developments are. In this article, we explore historical price movements and what to expect in the coming period.
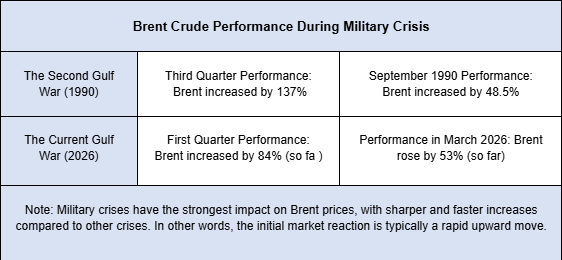
We begin by examining oil price movements, particularly in light of supply disruptions following the closure of the Strait of Hormuz, the world’s most important maritime and economic chokepoint. Nearly 20% of global oil and gas supplies pass through this route. Data shows that military tensions have a greater impact on prices than other types of crises, as illustrated in the table below.
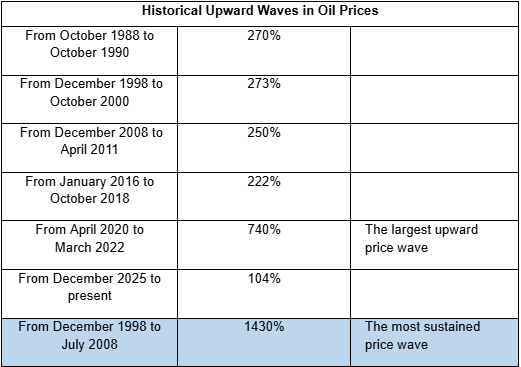
The table below captures the largest upward price waves, showing that oil recorded its strongest increase following the COVID-19 crisis, rising by as much as 740%. This wave extended over a two-year period and was supported by crude prices reaching historic lows beforehand. Despite ongoing volatility, the most sustained upward wave remains the one spanning from December 1998 to July 2008:

The question now is how far can the current upward wave continue, and which price levels should be closely monitored? The chart above shows a resistance zone around $130 per barrel, a level that Brent has attempted to break on several previous occasions. A move above this level could signal a continuation and extension of the current wave toward new price levels.
As for gold, the metal has declined by approximately 25% since the end of January 2026, marking a sharp and accelerated correction. Notably, last week recorded the fourth-largest weekly decline in history, with losses reaching 10.4% per ounce. The table below outlines the most significant historical declines in gold.
| 21-2-1983 | Gold declined by 12.1%. |
| 9-3-1980 | Gold declined by 12.40%. |
| 20-1-1980 | Gold declined by 22.8% |
| 29-10-1978 | Gold declined by 10.2% |
As gold breaks below its 100-day average, the focus now shifts to the key levels to watch in the coming period. The chart highlights a stabilization in the decline around the 200-day average at approximately $4,090 per ounce, which we consider a key support zone. The upward trend is expected to remain intact as long as prices do not close below this level.

In conclusion, prices will remain closely tied to ongoing developments and their evolution, as markets continuously reflect shifting expectations.Tracking both key events and important price levels will be essential in anticipating the next phase of market movement.
-1784545062.webp)

-1783942758.webp)
-1782905100.webp)