Intermarket analysis
Intermarket analysis involves monitoring interrelated multiple asset classes. You might be wondering which asset classes are interrelated, well, all of them are. For example, stocks may be positively or negatively correlated to bonds or the dollar, which is part of the currency market. This concept was first introduced by John Murphy in his book “Trading with Intermarket Analysis”, where traders may find value and benefit in studying the relationships between different asset classes.
How intermarket analysis works
Intermarket analysis focuses on the correlation between different asset classes. Some markets move together while others may move in the opposite direction, or swing between positive and negative correlations. A good example of intermarket relationship is the US stock market and the US bonds market, especially US corporate and government listings.
Different types of correlation
Positive correlation
A positive correlation (Figure 1) means to two instruments or markets move in the same direction. Correlation readings vary between 0 and 1 with the latter meaning perfect in tandem movements. This is rare but positive correlations between 0.7 and 0.9 are common and show a strong relationship between the two assets being studied. If the correlation continues in the long-term, it means a strong relationship that will always provide insight when analyzed.
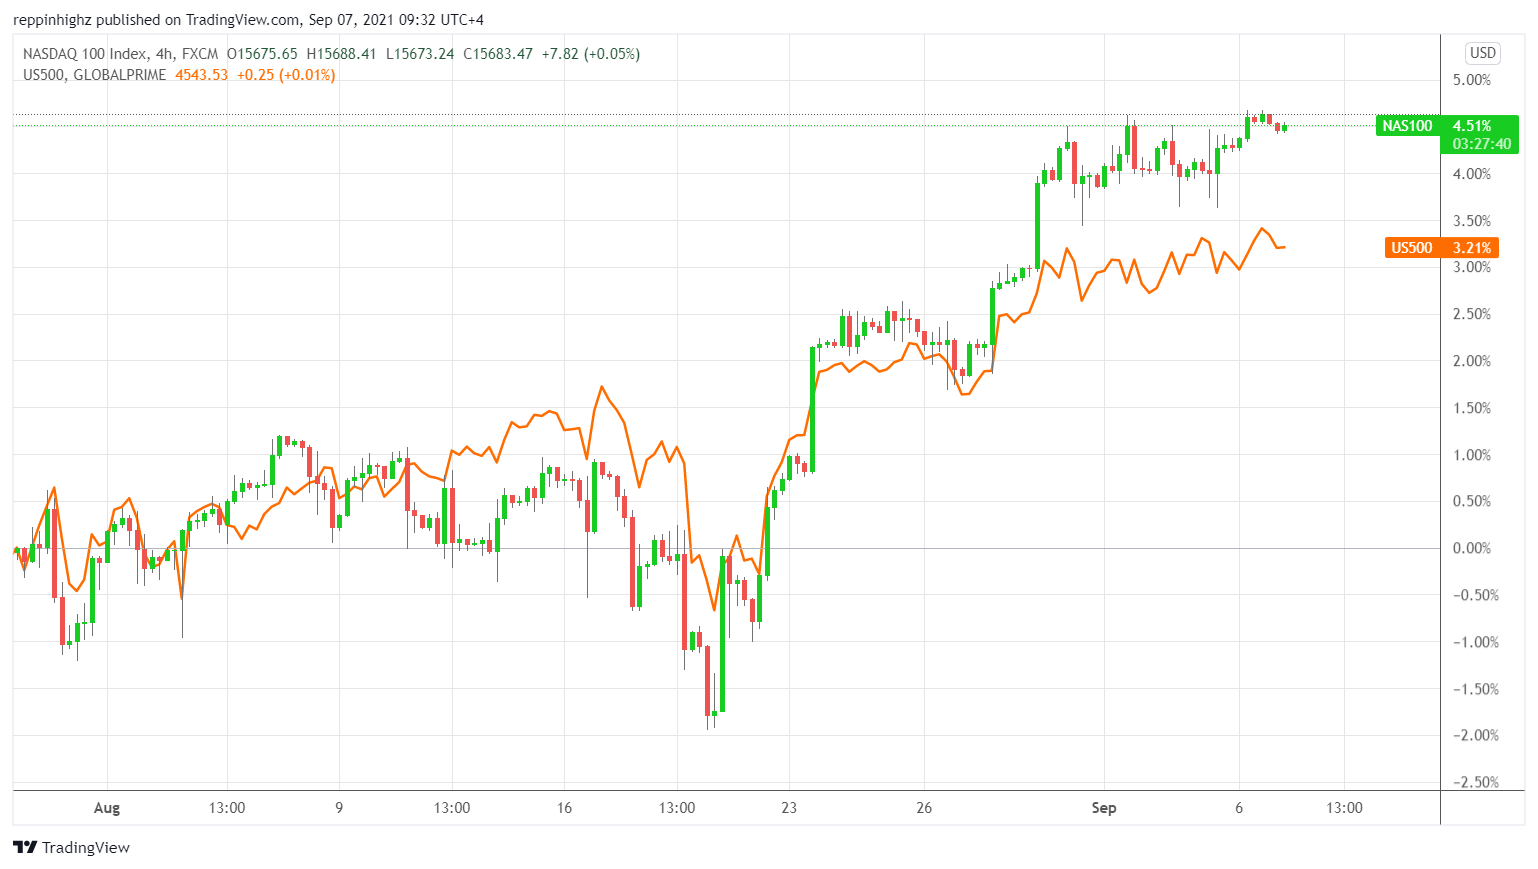
Figure 1 – 4-hour S&P500 and Nasdaq chart
Negative correlation
A negative correlation refers to two instruments or markets that move in the opposite direction. Readings vary between 0 and -1. A reading of -1 indicate a perfectly opposite relationship but this is rare. Readings between -0.7 and -0.9 are common and show a strong negative relationship between two assets or markets, especially if sustained for a long period of time. The relationship between two assets or markets in the weakest If the correlation is closer to 0.
Deflationary and inflationary relationships
Inflationary
If inflation rate is high, it means a positive correlation between bonds and stocks. In other words, if the value of bonds rise, stocks will also rise. One advantage of this relationship is that bonds move direction before stocks, that means weakness in bonds could turn out to be an upcoming decline in stock prices.
Within the same inflationary environment, there is usually a negative correlation between the US Dollar and major commodities, as well as between bonds and commodities. In this case, when the US Dollar rises, commodities will see lower prices and when bonds increase in price, commodities tend to decline.
Deflationary
During economic deflation there is a negative correlation between stocks and bonds. When the price of stocks increases, the price of bonds tends to decrease. Simultaneously, there is a positive correlation between stock prices and interest rates considering that rates are opposite to the price of bonds.
Historical data has shown a negative relationship between the US Dollar and commodities and between commodities and bonds. The only positive correlation is between stocks and commodities.
Importance of using Intermarket analysis in your trading
Early warning signal
Bonds and their interest rates play an important role in countries' economies regardless of their relationship with stocks. With time, bonds have become an early warning system as they move and make trends before trading stocks and other markets. investors analyse the trends to examine any type of change in the price.
Changes in correlation
An important signal is when a highly positive or negative correlation breaks down (Figure 2). Such disconnections could mean different things. Firstly, it may indicate that an asset may be undervalued or overvalued and tends to align with the other one. The opposite may occur with the overvalued or undervalued asset experiencing a sharp reversal with more stable asset. This trading strategy has given a rise to pairs trading, building on disconnections between highly correlated assets. If the breakdown in correlation continues, it might also indicate a trend change or a potential market reversal
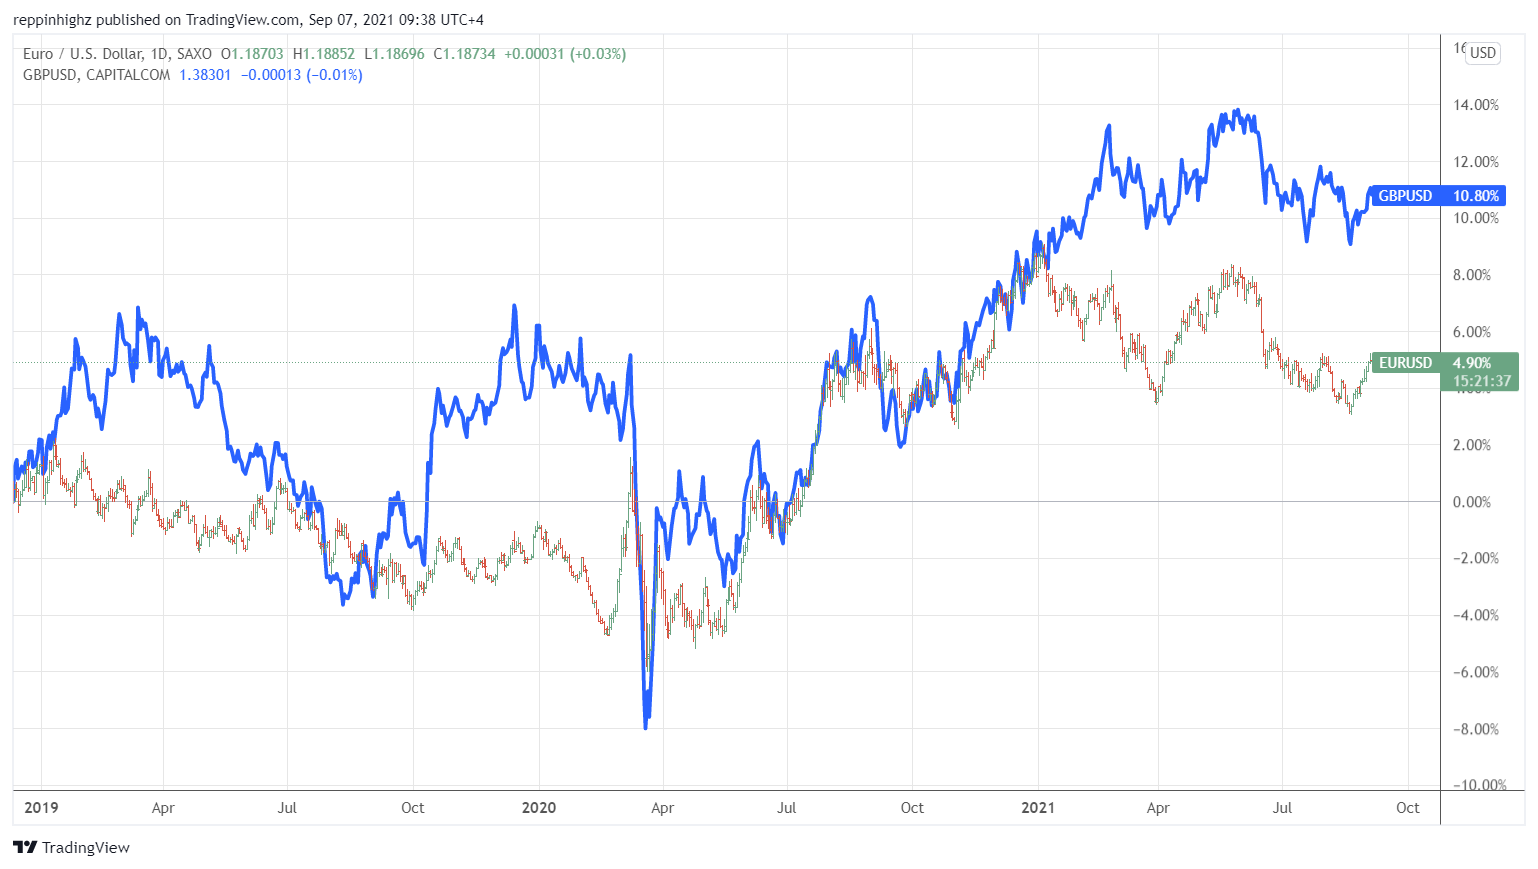
Figure 2 – Daily EURUSD and GBPUSD chart
Regardless of the scenario, a breakdown in correlation could indicate fundamental shifts that could affect both instruments, one way or another.
Technical analysis and Intermarket analysis
Regardless of the situation, a breakdown in correlation could indicate fundamental shifts that could affect both instruments, one way or another
Technical analysis and Intermarket analysis
Whether bond markets show a reversal, or a breakdown of correlation, it’s important to look for technical trends that will help time entries for trades in support of your own intermarket analysis. This means applying traditional technical analysis principles to a situation that already contains a strong probability of a specific direction. In other words, technical analysis would complement intermarket analysis and help trades build more confirmation and confidence when looking to initiate a trade based on intermarket analysis.
How to calculate correlation
It is relatively easy to calculate correlation for two sets of data. Let’s assume the Dow Jones is “x” and the oil is “y”. Follow the below steps to learn how to calculate the correlation between two instruments:
Step 1: Find the mean of x and y
Step 2: Subtract the mean of x from every x value available and do the same for y
Step 3: Calculate: a*b, a^2 and b^2 for every value
Step 4: Sum up ab, sum up a2 and sum up b2 (calculate the totals for each)
Step 5: Divide the sum of ab by the square root of [(sum of a2) × (sum of b2)]
Here is an example of a random set of data and its correlation:
| Dow Jones | Oil | x | y | xy | x^2 | y^2 |
| 12500 | 55.55 | 119.5 | -0.505 | -60.3475 | 14280.25 | 0.255025 |
| 12300 | 55.1 | -80.5 | -0.955 | 76.8775 | 6480.25 | 0.912025 |
| 12200 | 55.35 | -180.5 | -0.705 | 127.2525 | 32580.25 | 0.497025 |
| 12100 | 55.45 | -280.5 | -0.605 | 169.7025 | 78680.25 | 0.366025 |
| 12350 | 56.3 | -30.5 | 0.245 | -7.4725 | 930.25 | 0.060025 |
| 12415 | 56.15 | 34.5 | 0.095 | 3.2775 | 1190.25 | 0.009025 |
| 12700 | 56.9 | 319.5 | 0.845 | 269.9775 | 102080.25 | 0.714025 |
| 12580 | 56.8 | 199.5 | 0.745 | 148.6275 | 39800.25 | 0.555025 |
| 12450 | 56.85 | 69.5 | 0.795 | 55.2525 | 4830.25 | 0.632025 |
| 12210 | 56.1 | -170.5 | 0.045 | -7.6725 | 29070.25 | 0.002025 |
| 12380.5 | 56.055 | 775.475 | 309922.5 | 4.00225 | ||
| Median | Median | Sum | Sum | Sum | ||
| x^2 * y^2 | sq of x^2 * y^2 | xy/sq | ||||
| 1240387.326 | 1113.726773 | 0.696288 |
In this case, we see a correlation of 0.6962 which already indicates a strong positive correlation, and one that is close to the 0.70 which is serving as a benchmark for a very positive relationship between two assets. In this example, the data presented is small, meaning it may not indicate a long-term or sustained correlation. However, it still gives an idea of how two instruments can move together in opposite direction.
Microsoft Excel can help with quicker calculations of data as well as the ability to visualize the different sets of data for a better understanding of how certain markets move. It’s very possible to spot certain anomalies or patterns by just observing how two assets behave towards each other over a period.
South African Rand (ZAR) as a Key Indicator
For Economies -- A strong ZAR boosts investor’s confidence in the South African economy, making them interested to invest in South African market whereas a weak ZAR can reflect domestic or global economic challenges.
For Commodities – South Africa being a major exporter, the ZAR’s value is strongly correlated with commodity price movements of gold or platinum. rising gold prices often lead to ZAR strength due to increased foreign investment.
Final thoughts
Studying intermarket relationships is not an easy process as it takes time to master. Although analysing these relationships can be highly beneficial for traders and serve as a guide when any instrument may be lagging or disconnected from another whose value is persistent. It depends on how a trader learn and understand the relationship between different assets and how they utilize the hints and early warnings.