

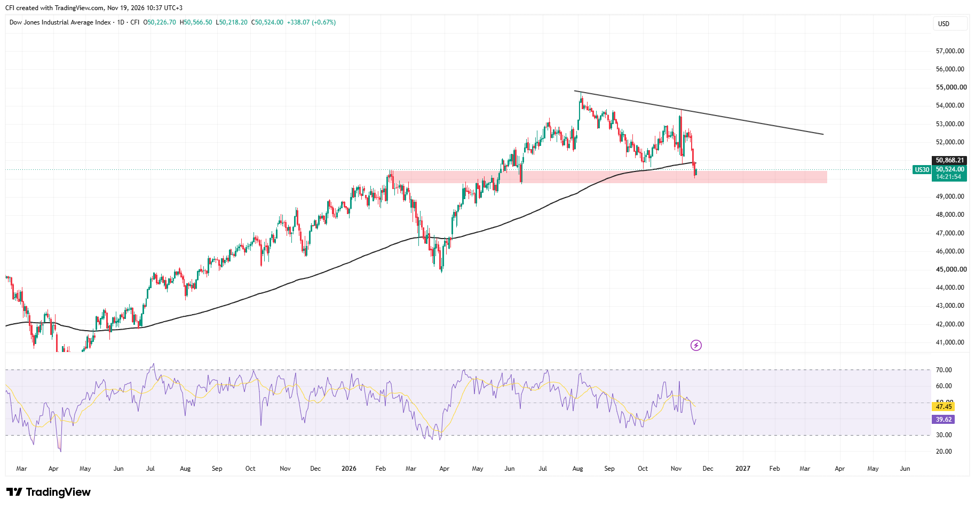
 US30, Timeframe: 1D, Soucre: TradingView
The Dow Jones Industrial Average has pulled back from its August record high near 54,700 and now trades around 50,500, where several technical references on the daily chart meet. On a broader view, the long-term uptrend that began in 2025 is still intact. The decline has brought price back to an area that has acted as both resistance and support this year.
Lower high below the descending trendline
A descending trendline runs across the index’s swing highs since the August peak. The early-November rally reached the 53,800 area but stalled beneath this line, setting a lower high than August. Price then fell sharply and gave up the November advance within a few sessions.
200-period EMA
The 200-period exponential moving average (black), now near 50,868, has tracked the uptrend from below for most of the past year. It held as support during the September to October pullback, when price stayed just above it. The latest decline has taken price back below the average. This is the first daily move beneath it since the March to April correction, when the index briefly traded under the 200 EMA before recovering.
Former resistance zone now being tested
The highlighted zone, roughly 49,700 to 50,400, started as the February high, which capped price before the spring correction. After the index broke above it in June, the area was retested as support. Price is back in this zone, with the latest sessions trading inside it, and the 200 EMA sits just above.
Momentum below the midline
The RSI is near 40, below its signal line near 47. Since August it has mostly stayed between 35 and 60 and hasn’t returned to the overbought readings seen in July. Momentum is subdued, but the RSI is still above the oversold threshold of 30.
What to watch
Below, the key area is the 49,700 to 50,400 zone, which has served as both resistance and support this year. Above, the first reference is the 200 EMA near 50,870, followed by the descending trendline from the August high. The way price trades between the support zone and the 200 EMA should show whether the broader uptrend holds or the pullback deepens.