


-1780481118.webp)
 GBP/USD, Tools: BB (20,SMA, Close,2), Time frame: 4H
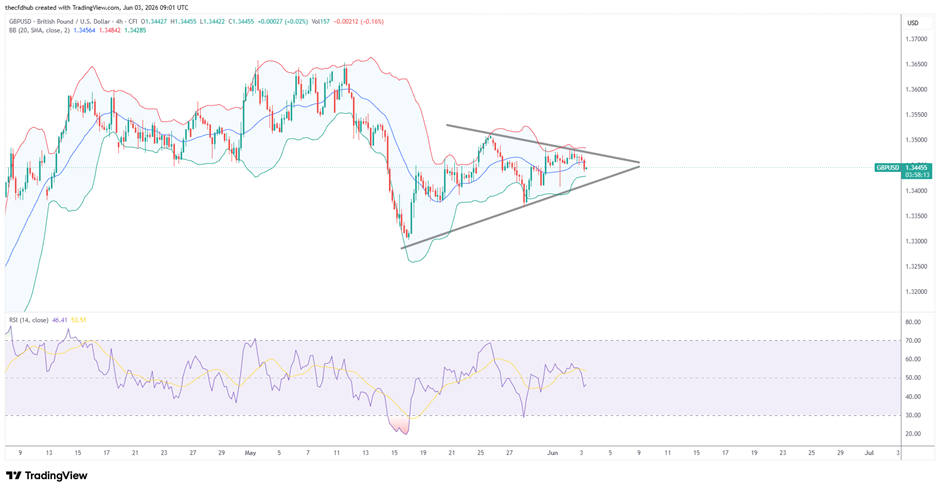
GBP/USD is trading within a symmetrical triangle pattern, characterized by lower highs and higher lows that are compressing price action between converging trendlines. This formation typically signals a period of consolidation as the trading range continues to narrow.
Lower highs signal limited upside potential
Recent price action has formed a series of lower highs, with the descending trendline acting as near-term resistance. Each bullish attempt has encountered selling pressure near this level, preventing a sustained move higher.
Rising support remains intact
On the downside, an ascending trendline continues to provide support, with multiple price reactions confirming its significance. Price remains above this support level, helping to prevent a deeper pullback for the time being.
Bollinger Bands continue to contract
The Bollinger Bands are narrowing, highlighting a decline in volatility as price consolidates within the triangle formation. Price is currently trading near the middle band, reflecting a neutral market environment.
Moving average indicates lack of directional bias
The 20-period moving average has flattened and is closely tracking current price action, suggesting a lack of strong directional momentum in the short term.
Momentum remains neutral
The Relative Strength Index (RSI) is fluctuating within the 45–55 range, indicating balanced momentum and the absence of overbought or oversold conditions
-1783413496.webp)
-1782988482.webp)
-1782904721.webp)