Introduction
Current U.S. inflation data suggests that markets are closely monitoring the 3.7% level as a key pivot point in the upcoming phase, particularly amid growing uncertainty surrounding the future path of inflation.
Based on recent monthly inflation readings, both technical indicators and market expectations are increasingly pointing toward a potential test of this level, driven by several key factors.
First: Technical Analysis of Inflation Levels
From a technical perspective, the chart shows the formation of a head-and-shoulders pattern at the end of the inflation downtrend. The projected technical target for this pattern is 3.7%, making it a focal point for traders and analysts.
In addition, this level represents a significant previous peak recorded in 2023, from which inflation later declined to levels close to 2.4%.
Second: The Importance of the Level for the Fed and Markets
What matters for financial markets and the U.S. Federal Reserve at this stage is that inflation does not break above 3.7%, as a breakout could signal:
- A renewed and stronger wave of inflationary pressures
- Higher probability of continued monetary tightening
- Negative implications for the labor market and economic growth
In contrast, the 3.5% area remains a nearby resistance zone, where inflation may stall without necessarily testing the 3.7% level.
Third: The Positive Scenario for Markets
If inflation manages to fall back below the 3% level, this could imply:
- Easing pressure on monetary policy
- Improved risk appetite in financial markets
- Reduced likelihood of additional tightening from the Federal Reserve
Conclusion: Are We Facing a New Turning Point?
The key question for markets today remains:
Will current policies succeed in bringing inflation back below 3%, or will a break above the 3.7% level trigger a new wave of inflationary pressures?
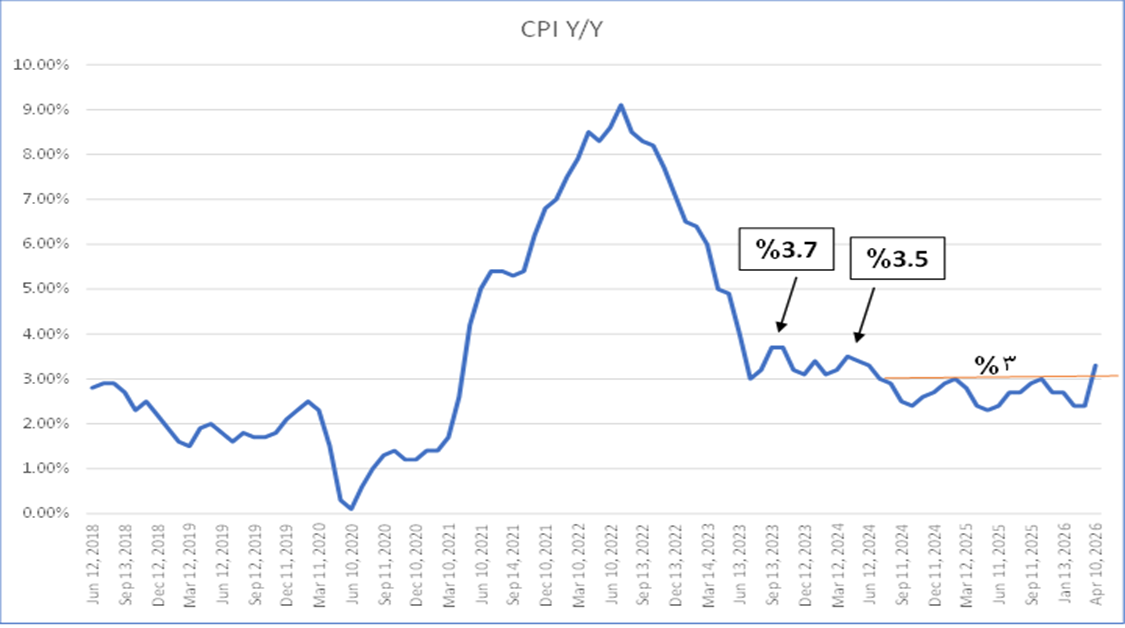 Figure: Annual Consumer Price Index (2018-April 2026)
 -1782026037.webp)