-1783413240.webp)
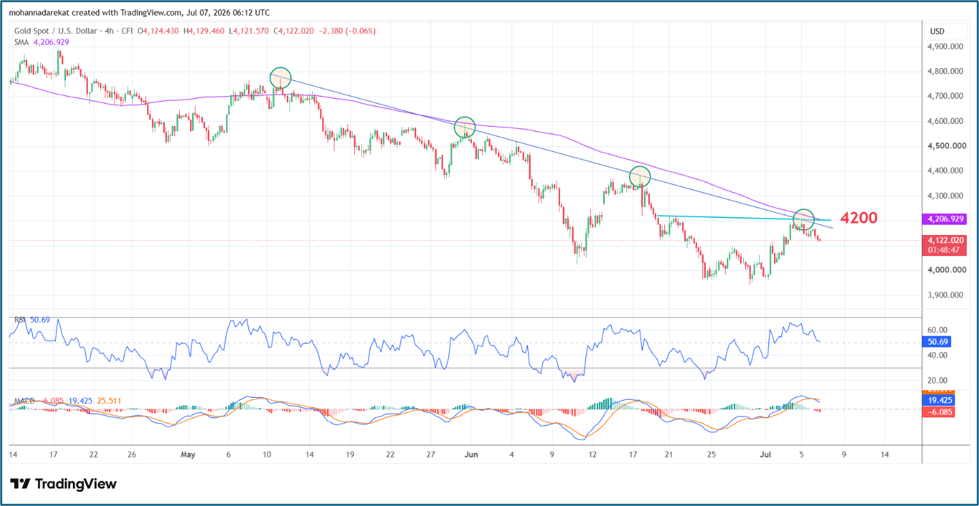
The attached chart highlights why the $4,200 per ounce level is a key area to monitor for gold price movements. This level represents:
- A horizontal resistance level confirmed by two major price touches.
- A descending trendline resistance that has generated several previous prices reversals.
- The 150-period moving average, adding further technical significance.
These factors suggest that it is still too early to adopt a bullish outlook unless gold successfully breaks above this technical resistance. While the formation of a double-bottom pattern at the end of the recent downtrend and a bullish weekly candlestick pattern are encouraging developments, both signals require confirmation through a sustained break above the $4,200 per ounce resistance level.
Gold gained approximately 2% last week, ending a multi-week decline after expectations for further U.S. interest rate hikes eased, supported by moderating inflation concerns and a weaker-than-expected U.S. employment report.
Looking ahead, the release of the June Federal Reserve meeting minutes on Wednesday could increase volatility in the gold market, as investors search for additional clues regarding the future direction of U.S. monetary policy, potentially providing a clearer outlook for gold prices in the coming sessions.
-1791447418.webp)


-1790754997.webp)