


-1782905100.webp)
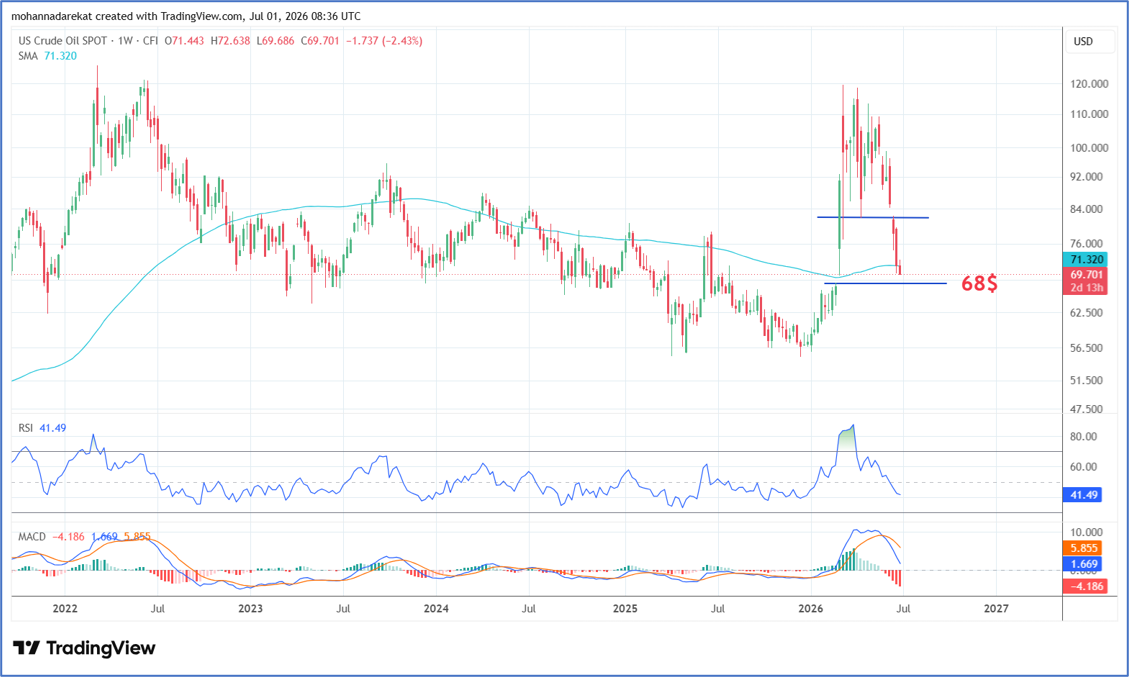 WTIUSD, Frame time: weakly, source: trading view
Oil prices continue to decline, currently trading near $69.7 per barrel, down approximately 2.3% since the beginning of the current week, 21% during June, and 31% since the start of the second quarter. These losses have brought prices close to filling a price gap around $68 per barrel, as shown on the accompanying chart.
Price gaps are generally considered support or resistance zones, depending on the direction of the preceding trend. Since the previous trend in oil prices was bearish, the area around $68 per barrel is expected to act as a support level that could help limit further declines. This is particularly significant as prices continue to trade below the 100-week Simple Moving Average (SMA), reflecting persistent long-term bearish momentum.
The resumption of oil flows through the Strait of Hormuz has been the primary driver behind these sharp declines, as concerns over supply disruptions have eased. The key question now is whether oil prices will manage to hold above the $68 per barrel support level, or if continued selling pressure will push prices below this level and extend the downward move.
-1784545062.webp)

-1784202577.webp)
-1783942758.webp)