





-1784202856.webp)
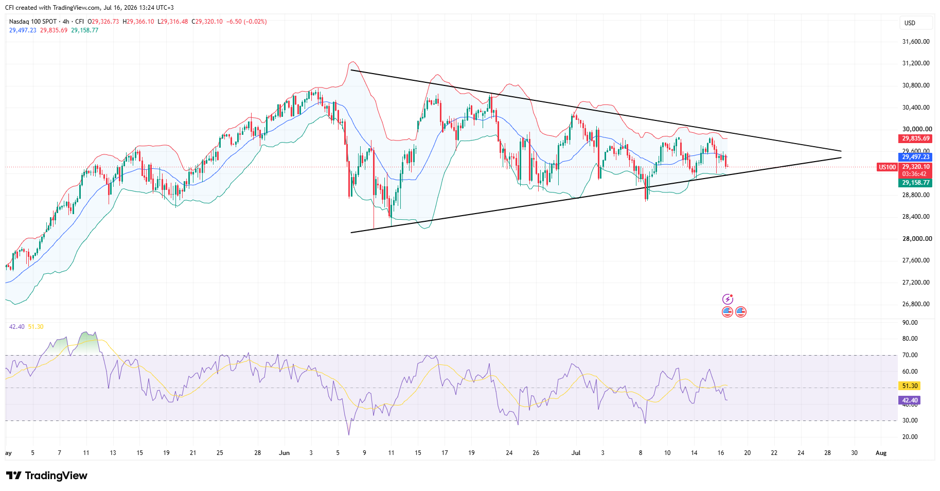 Nasdaq100, Time frame: 4h, source: Trading view
Analyst’s View The Nasdaq 100 (US100) remains confined within a symmetrical triangle, with lower highs pressing down from the June peak and rising support holding the pullbacks. Price action continues to compress as the pattern approaches its apex, suggesting a market waiting for direction.
Support Trendline Comes Back Into Focus
Recent price action has rotated lower after another failed attempt to challenge the upper boundary. The index is now trading near 29,340, putting the ascending support trendline back in focus as the nearest structural support level.
Bollinger Bands Reflect Ongoing Compression
Price is trading close to the middle Bollinger Band (29,504) after losing momentum near the upper band. Meanwhile, the Bollinger Bands have narrowed noticeably, reflecting declining volatility and reinforcing the consolidation narrative.
30,000 Area Continues to Cap Upside
The descending trendline remains the primary resistance level, intersecting with the psychological 30,000 region. Multiple rallies have been rejected beneath this area, confirming it as a significant supply zone within the triangle structure.
RSI Slips Below Neutral
The RSI has fallen to approximately 43, moving below both its signal line and the neutral 50 level. This suggests momentum has weakened in the short term, although the indicator remains comfortably above oversold territory.
Market Remains Range-Bound
Despite the recent pullback, price continues to hold within the broader triangle formation. Neither buyers nor sellers have established a decisive advantage, leaving the index trapped between rising support and descending resistance.
-1790667493.webp)


-1789380546.webp)
-1786607380.webp)