


-1724934015.webp)

The EUR/USD pair is heading into two very important trading sessions in terms of economic data and news.
On the U.S. dollar front, markets are awaiting today, Wednesday, September 10, the Core Producer Price Index (monthly), where expectations point to a decline from 0.9% to 0.3%, and the Producer Price Index (monthly), where forecasts also suggest a drop from 0.9% to 0.3%. The current monthly PPI reading is considered very important because the last reading rose to its highest level since June 2022, and markets are anticipating some declines.
EUR/USD Forecast Amid ECB Meeting and U.S. Inflation Data Releases
On Thursday, September 11, U.S. inflation data will also be released, with expectations for the Core Consumer Price Index (monthly) to remain steady at 0.3%, and the annual Consumer Price Index to rise from 2.7% to 2.9%. These data carry many important messages for the upcoming Federal Reserve meeting on September 17. If the annual CPI falls below 2.7%, this increases the probability of a U.S. interest rate cut by around 25 to 50 basis points, especially with the weakness in the labor sector.
As for the euro, European markets are awaiting the European Central Bank meeting on Thursday, September 11, where expectations point to keeping the interest rate at 2.15%, while attention will be focused on the upcoming economic forecasts of the ECB.
Technical outlook for the EUR/USD pair away from the news and its potential strong impact on the pair’s movement:
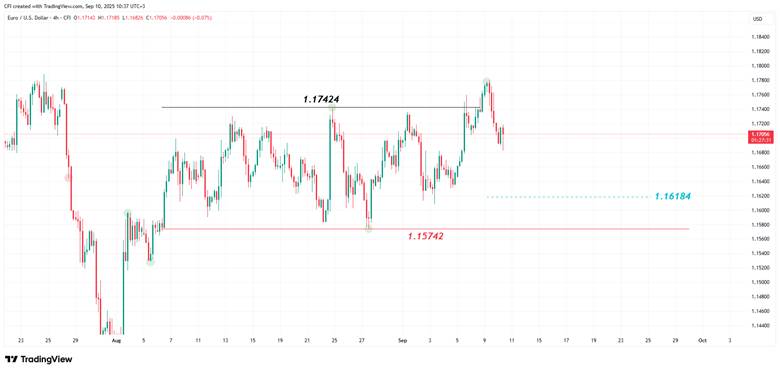
Figure 1: EURUSD, H4, Trading view
The EUR/USD pair traded in a sideways range for a full month between the level of 1.17424 as a resistance line and the level of 1.15742 as a support line, until the level of 1.17424 was breached and a bottom was recorded above it to continue the upward trend. If the U.S. dollar experiences further weakness against the euro, the current declines are expected to be corrective, aiming to touch the level of 1.16184 before resuming the upward movement again.
Meanwhile, the level of 1.15742 represents an important support line; if it is broken and a bottom is recorded below it on the 4-hour timeframe, this would indicate a trend reversal from bullish to bearish on the 4-hour chart, in line with the downward trend on the daily timeframe, according to analyst analysis.


-1751465072.webp)
