


In trading, few pitfalls are as deceptive as the “bull trap” a situation where a rising market appears to turn bullish, luring in buyers, only to reverse downward soon afterward. For many traders, falling into a bull trap can mean entering long positions too early and suffering losses when the market resumes its decline. As financial analysts, we must understand what causes these traps, how to recognize them, and what strategies can mitigate risk.
What Exactly Is a Bull Trap?
A bull trap is a false breakout upward. Imagine a resistance level that the price has tried to breach multiple times. Finally it breaks above that level, giving the signal that a bullish move is underway. Traders often act on that signal and go long (buy). But shortly thereafter, the price reverses, falling back below resistance. This traps those who bought in on the breakout, expecting gains.
Let’s apply theory to practice with a real-world example from the commodities market: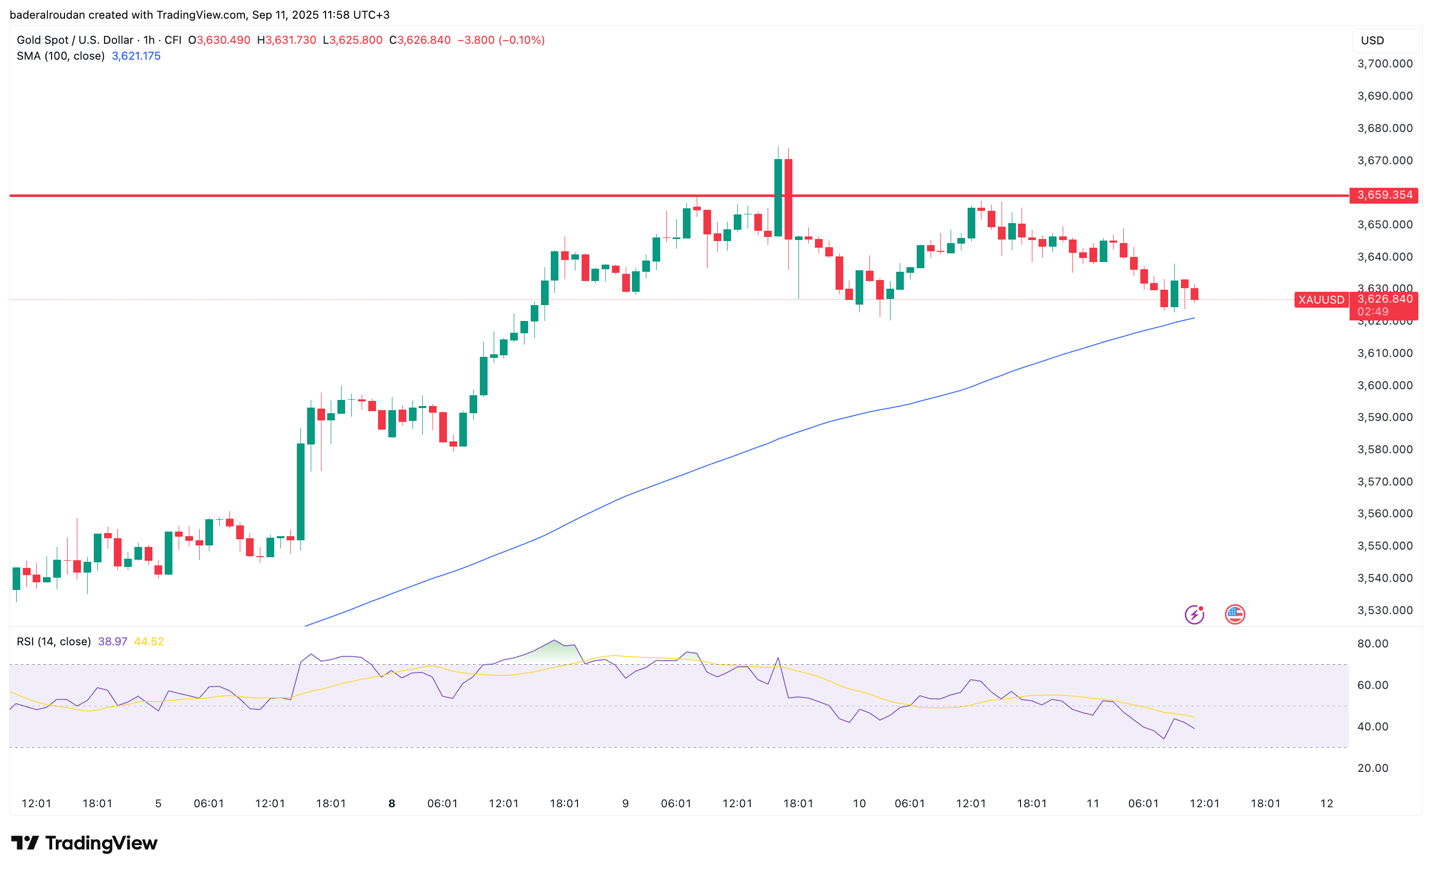
Gold Bull Trap Unfolds After Breaking All-Time High Near $3,675
In a recent trading session, gold broke above a critical resistance level near $3,660, surging to an all-time high (ATH) of approximately $3,675. At first glance, this appeared to confirm a bullish breakout, volume spiked, sentiment turned optimistic, and many traders entered long positions expecting a sustained upward move.
However, as shown on the hourly chart, just an hour later, the price collapsed below the same $3,660 resistance line, invalidating the breakout. This price behavior perfectly fits the definition of a bull trap.
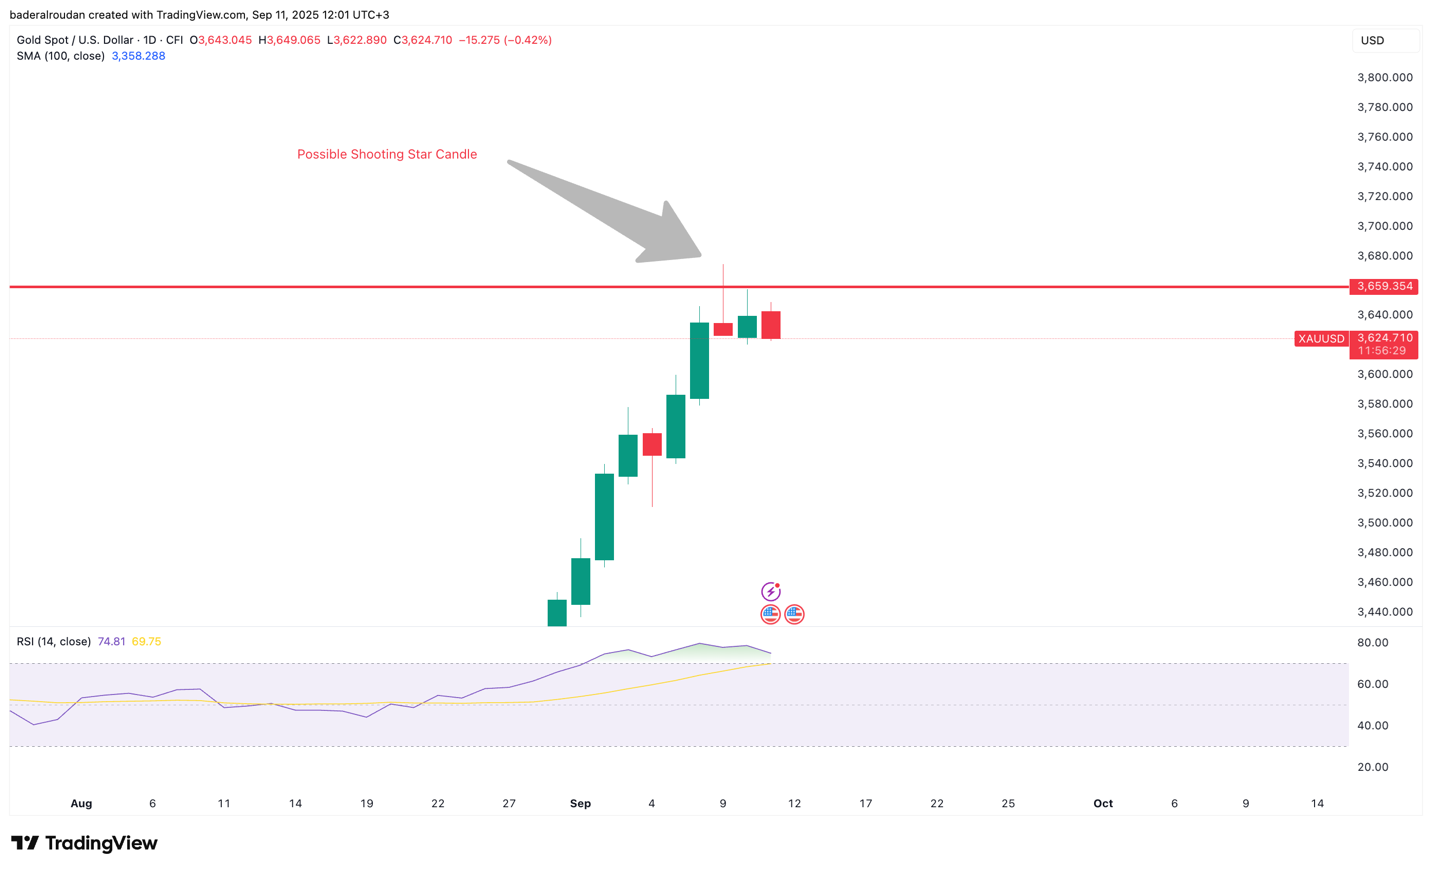
Further supporting this trap scenario, the Daily Timeframe chart revealed key technical rejection signs:
Price failed to close above the resistance zone.
shooting star candlestick began to form, characterized by a small body and a long upper wick, indicating that sellers overwhelmed buyers at higher levels.
Momentum indicators such as RSI likely showed divergence, further warning of a weakening bullish push.
This example highlights how even strong technical breakouts can fail without confirmation, and underscores why UAE traders must assess multiple timeframes and indicators before committing to a trade.
There are a few common market conditions under which bull traps tend to occur:
- Sideways or range-bound markets: In these cases, price range between support and resistance. A breakout above resistance may be mistaken for the start of a bullish trend, yet may fail and slip back into the range.
- End of an uptrend: Even in a bullish environment, as momentum weakens and sellers become more active, the market might give one more “breakout” before reversing sharply. That final push can trap buyerExplore Technical Analysis Course in UAE now
What Causes Bull Traps?
From a technical perspective:
A bull trap often stems from insufficient buying pressure. When the breakout above resistance is weak (in volume or momentum), sellers can step in and overwhelm the buyers.
Fundamental triggers: Negative news, geopolitical risks, or earnings misses can accelerate the reversal.
Some of the key technical signals and contributing factors:
- A breakout occurs, but volume is low, meaning not enough participants are backing the move.
- Divergences between price action and momentum indicators. For example, the price might make a higher high, but an indicator like the Relative Strength Index (RSI) makes a lower high (bearish divergence). That foreshadows weakening strength.
- Certain candlestick patterns showing that after a brief surge, sellers reassert themselves, like long upper wicks, reversal candles.
How to Avoid Falling into a Bull Trap in Trading?
As with many risk exposures in trading, preparation and disciplined is a must.
Here are practices that may likely reduce the risk of being caught in a bull trap:
1. Wait for confirmation
Before entering a long position following what looks like a breakout, wait for confirmatory, like sustained closing above resistance, increasing volume, supportive momentum indicators, and perhaps retest of resistance turned support.
2. Use solid risk management
Always define exit points. A stop loss order should be placed at a logical level. Trailing stops can help lock in gains or reduce losses if the market reverses.
3. Watch for candlestick patterns
Look for shooting stars, inverted hammers, or candles with long upper shadows near resistance levels, all signs that selling pressure may be building.
4. Assess volume carefully
Strong breakouts tend to be supported by surges in trading volume. If a breakout occurs without volume backing it, approach with caution.
Bull Trap vs Bear Trap: A Quick Contrast
It’s helpful to compare bull traps with bear traps:
- A bull trap misleads traders into opening long (buy) positions on the belief that prices will rise, but then reverses downward.
- Conversely, a bear trap tricks traders into opening short (sell) positions under the expectation of a price drop, but then the price reverses upward.
In sum, a bull trap is a warning that bullish momentum may be fading, even when price action seems to promise more. Recognizing when that promise is hollow, and acting accordingly, is a mark of disciplined, experienced market trader.


