


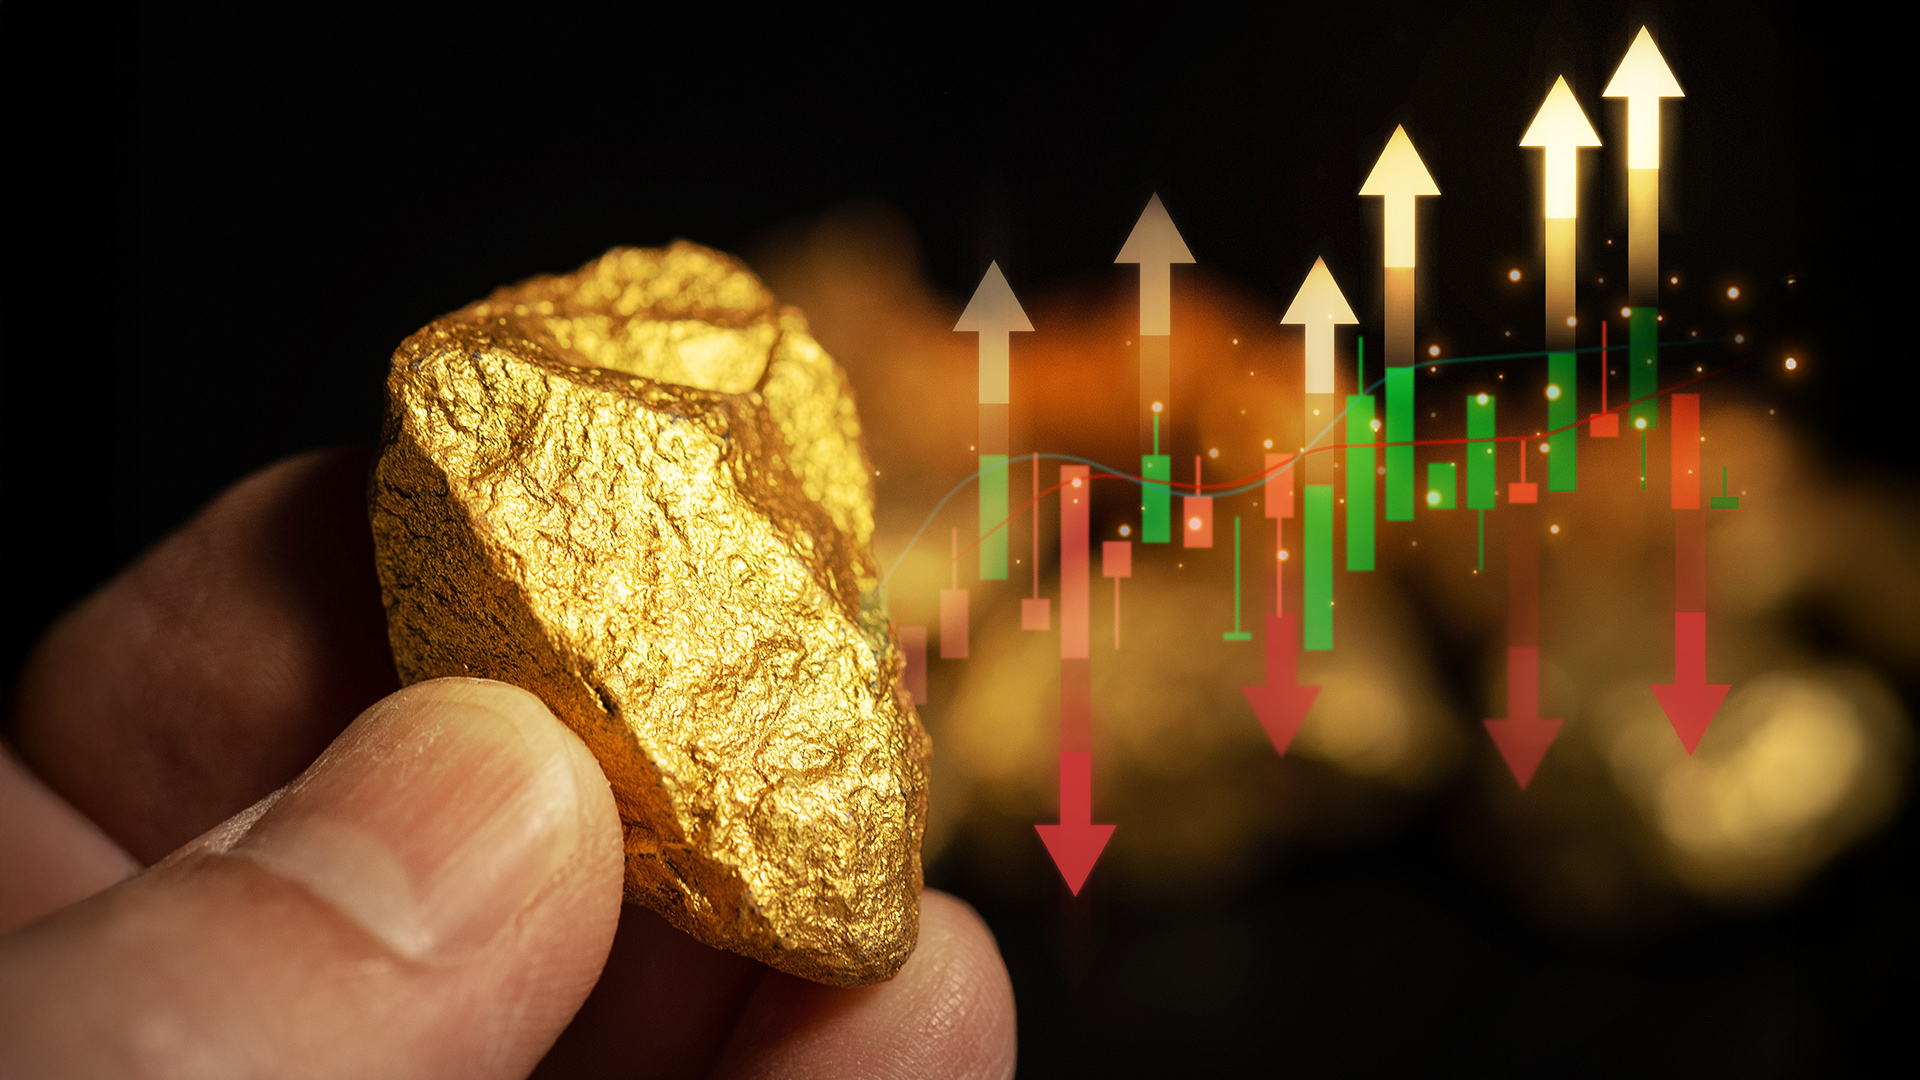
On January 30th, precious metals declined substantially. Gold plummeted more than 12% during that day, representing its largest daily percentage fall since the 1980s. Silver also experienced a substantial fall, losing more than 35% on a single day, representing its largest daily percentage fall ever. In three days, silver fell by 41%, while the price of gold fell by more than 25% from its high. For many new market participants, this was the largest single-day decline they had ever witnessed.

The recent drop in precious metals was no random event; rather, it was a full-scale meltdown of the market following the announcement of Donald Trump's nomination of Kevin Warsh as Fed Chair, which might be viewed as a more hawkish choice signalling a tougher stance against inflation, thereby strengthening the US Dollar and putting pressure on dollar-denominated commodities.
The Chinese Connection
While the recent meltdown of precious metals has been blamed on the nomination of the Fed Chair, the reality of the situation is much deeper. For weeks, the speculative capital flowing into the market from China had driven prices to levels far above what the physical market could support. The result has been a market that has been full of speculative capital and disconnected from traditional fundamentals.
Margin Requirements and the CME "Squeeze"
When the markets get extremely volatile, the Chicago Mercantile Exchange (CME) Group increases the margin requirement, which is the deposit required to hold a futures contract, to protect the system from an imbalance. As the market hit record highs in late January 2026, the CME increased the margin requirement on gold from 6 percent to 8 percent and silver from 11 percent to 15 percent. This forced the highly leveraged speculators to either pour massive amounts of capital into the system or close out their positions instantly. This led to a forced liquidation, turning a market correction into a crash.
3 Things Traders Must Watch Going Forward — Especially for Gold and Silver in 2026
The 'Warsh' Confirmation & Dollar Strength: Keep an ear on Senate confirmation hearings for Kevin 'Warsh.' Any comments that reinforce the idea of a strong dollar could delay a meaningful bounce in metals.
The Chinese Lunar New Year Liquidity: With this holiday approaching in mid-February, a further reduction in Chinese speculative money could result in 'thin' markets with extreme, unpredictable price action. The Chinese New Year break runs from 16 February to 23 February 2026.
Industrial 'Dip-Buying': Despite a paper market collapse, silver is structurally in a deficit because of AI and solar demand. Traders should be watching to see whether physical premiums increase; a potential 'buying opportunity' that could signal a long-term bottom.
Gold & silver Technical Analysis February 2026
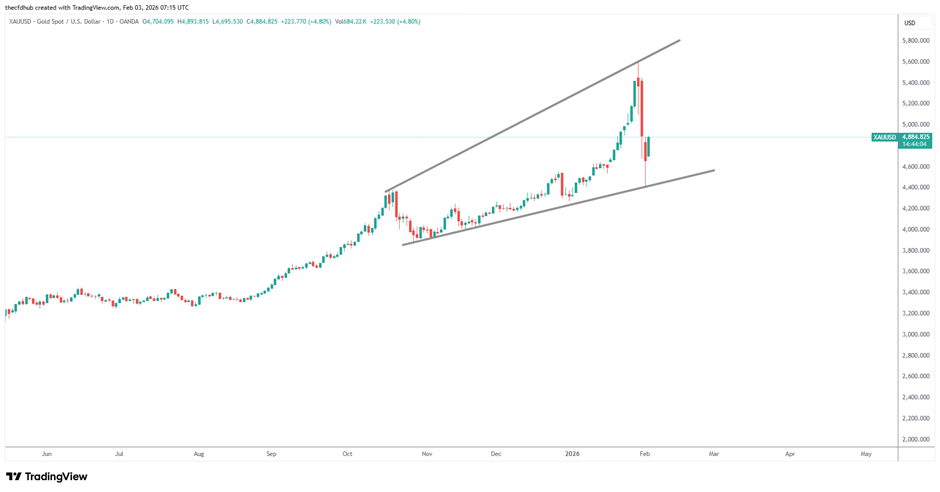 Gold Price Movement - Source: Tradingview 1D
The XAU/USD daily trading chart is a textbook example of a "Megaphone" or "Broadening Wedge." Such patterns are often associated with high uncertainty and intense battles between bears and bulls. Current Analysis: We have just witnessed an enormous rejection from the upper resistance line (near $5,600), followed by a rapid re-entry towards the midpoint.
Price Action & Key Levels for Gold and Silver Price
Resistance: The upper trendline is now a "hard ceiling." The recent rejection from there was abrupt and violent, indicating a strong supply level. Support: The level to watch is the lower trendline around the $4,400-$4,500 range. Holding this level will mean that the uptrend is still intact, while a breakdown will mean bearish sentiments are at play.
Explore Gold & Silver trading Now!Silver Summary
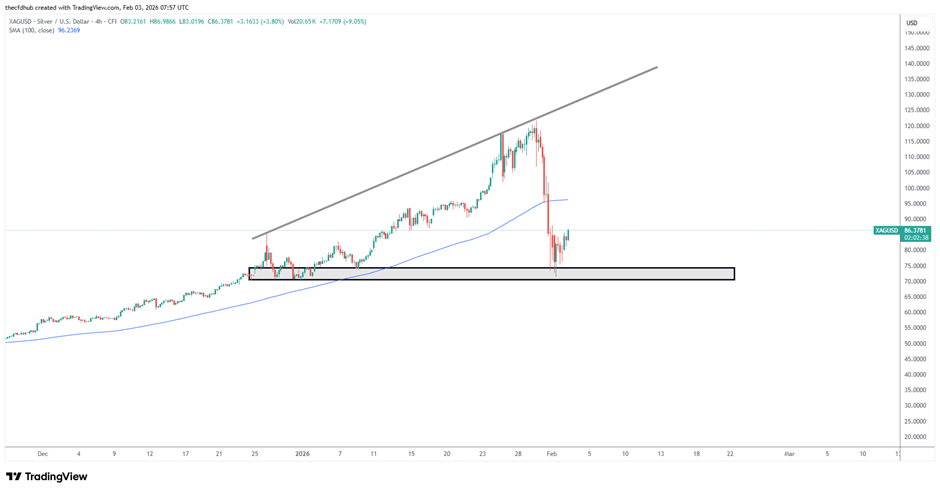 Silver Price Movement - Source: Tradingview H4
Silver (XAGUSD) trading has undergone a significant price correction, losing 34% of its value from $130 to $86, following a parabolic price move. From the 4-hour time frame, the price is seen to be testing the critical support zone around $72-$76, which is the breakout level from the late December price move. This is also a price zone that has been seen to consolidate in the past and is critical in determining the future price move. Currently, the price is at $86.50, which is the decision zone, while the 100-day SMA is at $96, which acts as resistance.
-1783942758.webp)
-1783413240.webp)

-1783336500.webp)
-1724934015.webp)