

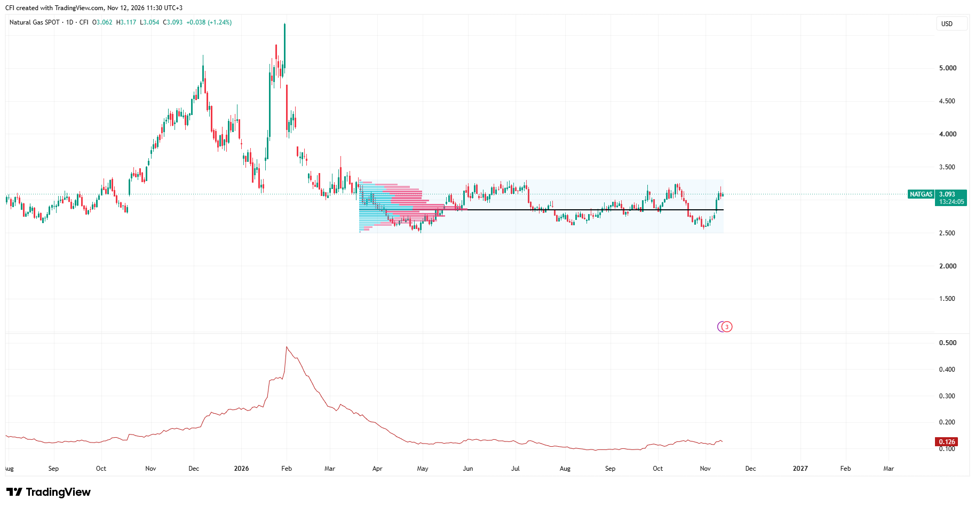
 NATGAS, Timeframe: 1D
US natural gas has largely been shielded from the conflict in the Middle East. While geopolitical tensions have pushed crude oil prices higher, natural gas has remained trapped in a prolonged battle between buyers and sellers, creating a balanced market with no clear winner.
The rise in oil prices encouraged previously idle US drillers to increase production. Since natural gas is often produced as a by-product of oil drilling, additional drilling activity has boosted gas supply. This increase in supply has helped keep natural gas prices contained despite the market heading into winter, a period that typically supports stronger demand.
How to Spot a Balanced Market Using Fixed Volume Profile
The chart highlights a classic balanced market structure.
Using a fixed volume profile, traders can identify where the majority of trading activity has taken place over a selected period. The area containing most of the traded volume is known as the Value Area, while the longest volume bar marks the Point of Control (POC), the price level where the most business has been conducted.
Key observations:
● The value area stretches approximately between $2.50 and $3.35.
● The POC is located near $2.85, represented by the black horizontal line.
● Price has repeatedly rotated around the POC throughout the year, indicating agreement between buyers and sellers.
● Multiple attempts to break above or below the value area have failed to generate sustainable trends.
This rotation between extremes is typical of a balanced market, where price spends more time moving back toward fair value than establishing a directional trend.
Volatility Suggests a Bigger Move May Be Approaching
The volatility indicator in the lower panel tells an equally important story.
After peaking during the explosive rally toward $5.00 earlier this year, volatility has declined dramatically and now sits near multi-month lows. Markets often alternate between periods of expansion and contraction, and extended periods of low volatility frequently precede significant directional moves.
The combination of:
● A balanced volume profile,
● Price trading near the upper half of the value area,
● And historically subdued volatility,
suggests that natural gas may be approaching an inflection point.
What Traders Should Watch
Natural gas is currently testing the upper portion of the range around 3.1 - 3.30, an area that has repeatedly attracted sellers throughout 2026.
For the bulls, a sustained break and acceptance above the value area high could signal the start of a new auction higher, with potential targets toward $3.50 and $3.80.
For the bears, another rejection from the upper extreme would reinforce the range environment and increase the probability of a rotation back toward the POC near $2.85, with the lower value area around 2.5- 2.60 becoming a downside objective