





-1791969153.webp)
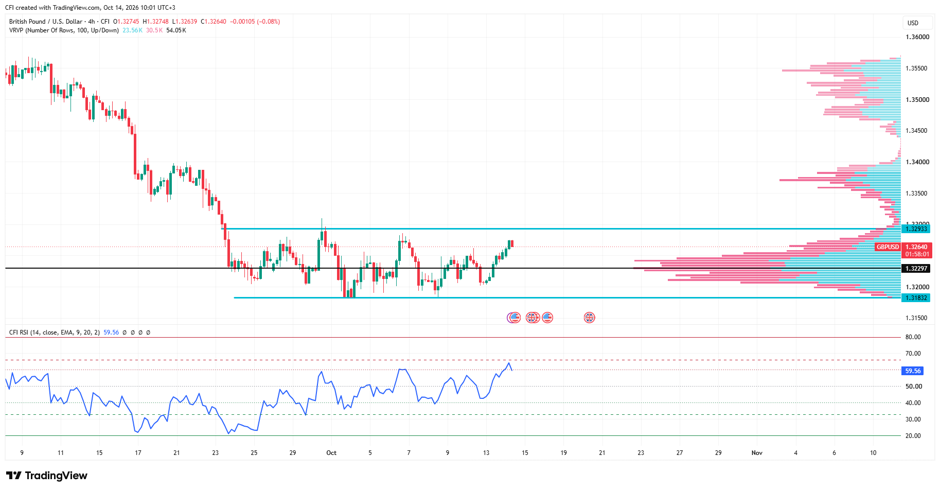
GBP/USD has staged a strong recovery from the lower end of its recent trading range, climbing back toward the 1.3293 resistance level. The pair is now testing the upper boundary of a consolidation zone that has contained price action since late September.
1.3293 Resistance Remains the Key Level
The most important level on the chart is the 1.3293 resistance zone, highlighted by the upper blue horizontal line. Previous rallies into this area have struggled to gain follow-through, making it a key hurdle for buyers.
A sustained move above this level would signal a potential shift in market sentiment and open the door to a move toward the higher volume areas around 1.3350–1.3400.
Point of Control Supports the Recovery
The volume profile shows the Point of Control (POC) at 1.3229, marked by the black horizontal line. This level represents the highest concentration of trading activity and has acted as an important pivot throughout the consolidation.
Price has successfully reclaimed and held above the POC, suggesting buyers have regained control of the range's value area.
Volume Profile
While price is approaching resistance, the volume profile shows substantial participation above current levels, particularly between 1.3350 and 1.3550. This suggests that if resistance gives way, there is room for price to explore higher value areas.
RSI Reflects Improving Momentum
The RSI has climbed to approximately 61.5, moving firmly above the neutral 50 level. Momentum has strengthened steadily from the recent lows, indicating growing buying interest as GBP/USD approaches resistance.
Although momentum is constructive, the indicator remains below overbought territory, leaving room for further upside should buyers maintain control.
-1791797000.webp)

-1791368114.webp)
-1791359420.webp)
