





-1788423989.webp)
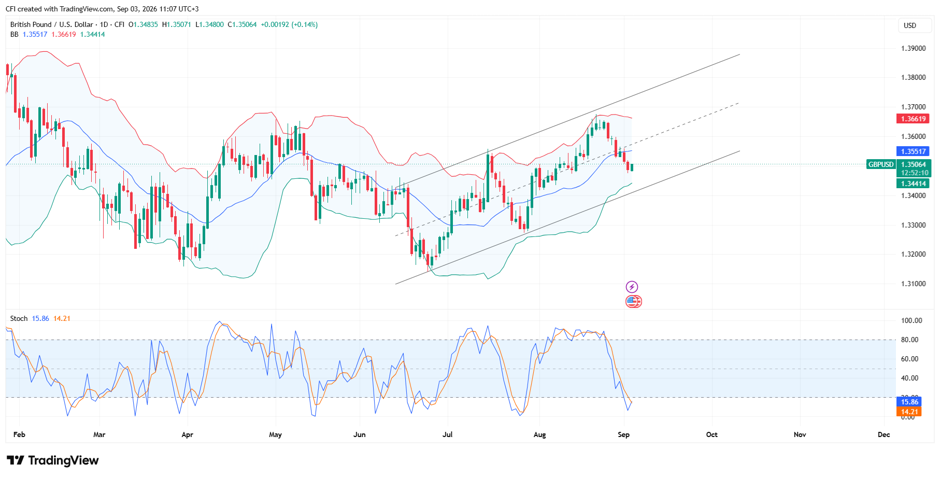 GBP/USD, Time frame: 1D
 GBP/USD remains in a clear uptrend on the daily timeframe, with price continuing to trade inside a rising channel. The broader structure of higher highs and higher lows remains intact, although recent price action shows buyers losing momentum after the latest rally.
The recent advance stalled around the 1.3650-1.3670 resistance area, where sellers regained control and pushed the pair lower. This zone has repeatedly attracted selling interest and continues to act as a key hurdle for bulls.
Price Pulls Back Toward Trend Support
Following the rejection near the highs, GBP/USD has retraced toward the lower end of the channel and is now trading around 1.3500. This area has previously attracted buyers and is an important level for maintaining the current bullish structure.
Bollinger Bands Reflect Cooling Momentum
Price has moved below the 20-period Bollinger Band average (1.3551) after spending several sessions in the upper half of the Bollinger range.
Upper Band: 1.3662
Middle Band: 1.3551
Lower Band: 1.3401
The move below the middle band suggests buying momentum has faded in the short term, while the lower band near 1.3400 becomes the next major support reference.
Stochastic RSI Near Oversold Levels
The Stochastic RSI has fallen sharply from overbought conditions.
%K: 14.07
%D: 13.61
These readings indicate momentum has cooled considerably and are approaching levels where traders often look for signs of stabilization or a potential bounce.
Support Remains the Key Focus
The immediate focus is whether buyers can defend the 1.3480-1.3500 support region. A sustained hold above this area would keep the broader uptrend intact, while a deeper move toward 1.3400 would place additional pressure on the recent recovery.
-1790754656.webp)


-1790668063.webp)
-1790235577.webp)