


-1781602508.webp)
 EURUSD, Time frame: daily, source: tradingview
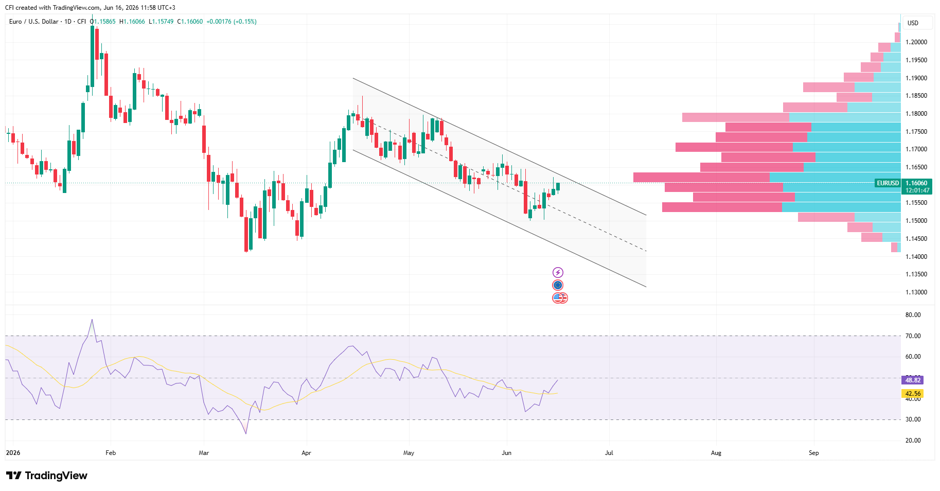
EUR/USD remains in a well-defined descending channel on the daily chart, with price currently attempting a modest recovery from the channel's lower boundary. The relief bounce has so far been contained below the channel midpoint.
Resistance
Immediate structural resistance is defined by the upper descending trendline of the channel, currently intersecting near the 1.1610 – 1.1630 zone. Beyond the channel boundary, the visible range volume profile reveals a prominent high-volume node extending up to 1.1650, which serves as the next major overhead barrier. A clean break above this cluster would encounter minimal volume resistance until the 1.1800 psychological level.
Support
The nearest key support rests at the 1.1550 level, which aligns with the lower shelf of the current high-volume distribution node. Deeper structural support is established along the midline and the lower boundary of the descending channel, currently mapping down toward 1.1450 and 1.1350, respectively.
Momentum
The Relative Strength Index (RSI) is currently reading at 48.64, rising from oversold conditions seen earlier in the month. The RSI line has crossed above its yellow signal moving average (42.55) and is coiling just below the neutral 50 centerline. This trajectory suggests that downward momentum is decelerating, though a definitive bullish shift requires a sustained move above the 50 mark.
Summary
The EUR/USD daily chart highlights a market at a pivotal technical juncture, balancing within a multi-month descending channel while interacting with a major high-volume node around 1.16048. Near-term downward momentum has slowed, as evidenced by the recovering RSI and the recent price bounce away from the channel's lower interior. Whether the pair undergoes a bullish breakout above channel resistance or experiences a rejection back toward local support depends on its ability to decisively clear the current concentration of volume overhead.
-1785402917.webp)
-1785318371.webp)
-1784791951.webp)
