





-1787125785.webp)
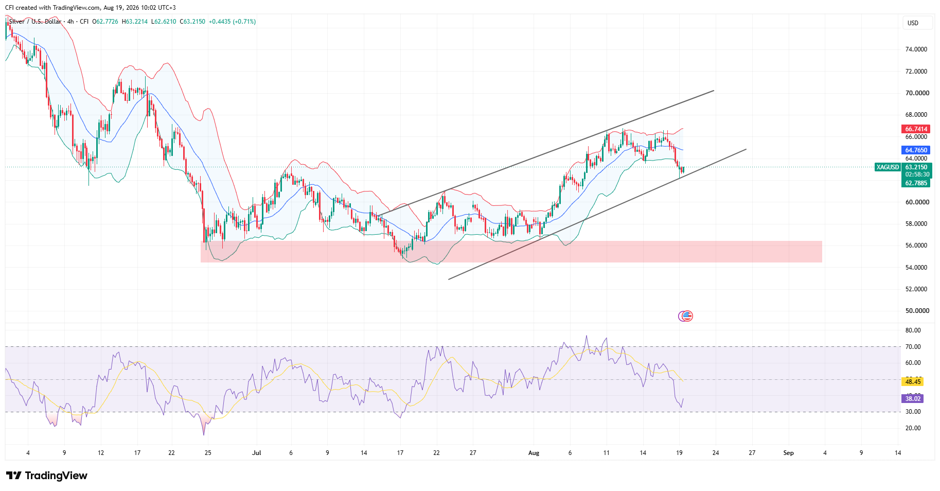 XAGUSD, Time frame: 4H
Silver on the 4-hour timeframe is currently at a key structural level. Following a pullback from its recent local high near $66.00–$67.00, the price has retreated directly toward the trendline support of the ascending channel that has guided the market higher since late July.
Channel Support
Price is currently hovering around $63.07 (with a candle low at $62.62), placing it squarely on the lower trendline of the multi-week channel. This trendline has consistently offered a strong floor for buyers during previous pullbacks.
Bollinger Bands Dynamics:
Upper Band ($66.75): Rejection here marked the top of the recent swing.
20-Period MA / Mid-Band ($64.75): Price closed decisively below this middle line, confirming a short-term shift from bullish momentum to deep consolidation.
Lower Band ($62.75): Current price action is hugging the lower band, signaling an oversold, high-compression state on this 4-hour chart.
RSI Momentum
The RSI (14) has dropped into the lower region near 36.44 (with the yellow signal line around 48.34). While nearing oversold territory (<30), it shows momentum cooling rapidly from the overbought peaks seen in early August, suggesting seller exhaustion may be close.
Recovery Structure Still Intact for Now
Despite the recent weakness, Silver continues to trade above the series of higher lows established since July. The market is currently testing whether trendline support can continue to contain the pullback.
-1790754997.webp)



-1789980568.webp)