-1785230374.webp)
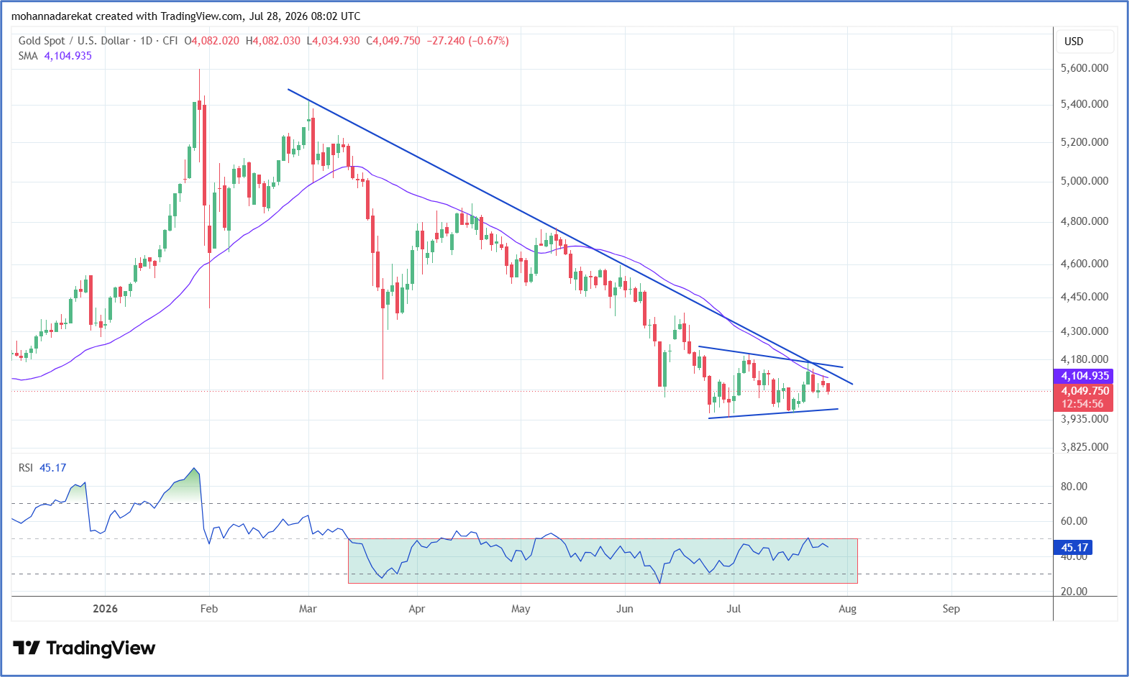 XAUUSD, Time frame: Daily, Tools: SMA35, Source: Trading view
By tracking gold price movements and based on the attached chart, we can see that the sideways trend continues within a triangle pattern, bounded by a resistance zone near the $4,200 level and a support zone around $3,950 per ounce. Today, gold is down approximately 0.6% and is trading near $4,050 per ounce. So, what factors are currently influencing gold prices?
- The US dollar remains stable near its highest level in a month, around 101.5, ahead of the Federal Reserve’s interest rate decision, which will be announced tomorrow, Wednesday. Markets are currently pricing in a 63% probability that rates will remain unchanged.
- Ongoing political uncertainty and caution continue to impact the global economy in general, and inflation in particular.
From a technical perspective, since price action is moving within a triangle pattern, which can either signal a continuation of the previous trend or a reversal, the following scenarios are the most likely:
- A breakout above the $4,200 resistance level would suggest a bullish outlook, especially as it represents the average price resistance over the past 35 days.
- A break below the $3,950 support level would indicate a bearish outlook and a continuation of the previous downtrend.
-1791447418.webp)


-1790754997.webp)