-1784202577.webp)
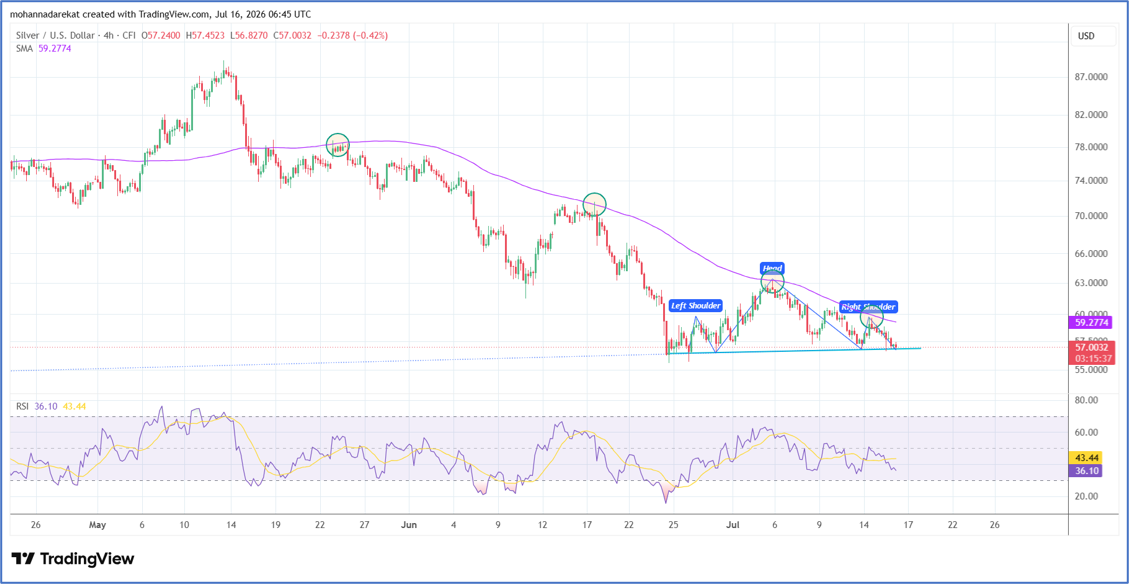 XAGUSD, Time Frame: 4H, Tools: SMA 100, Source: Trading view
Silver prices are currently trading near a key technical support zone while remaining below the 100-period moving average, reflecting the continuation of bearish pressure.Silver has declined by approximately 4.6% since the beginning of this week, 2.5% since the start of July, and is now down by more than 20% since the beginning of the year.The main factors behind this decline can be summarized as follows:
- Rising concerns that inflation could accelerate again, weighing on investor sentiment.
- Higher oil prices, which could encourage central banks to keep interest rates elevated or even raise them further to contain inflationary pressures.
- Markets are currently pricing in a more than 70% probability that the Federal Reserve will raise interest rates during the final quarter of the year.
From a technical perspective, silver is currently trading near $57 per ounce, an important horizontal support level that also coincides with the neckline support of a continuation head and shoulders pattern within the prevailing downtrend. A break below $56 could pave the way for further downside pressure.On the other hand, a recovery above $59.50, where the 200-period moving average is currently located, could signal the return of bullish momentum and the beginning of a new upward move.
Will silver regain positive momentum by breaking above $59.50, or will a break below the $56 support level open the door to further losses?
-1791447418.webp)


-1790754997.webp)