If you've ever looked at a price chart and wondered, “Why did the market turn around right there?” chances are, you were looking at a support or resistance level in action.
Support and resistance are the most fundamental concepts in technical analysis, and mastering them can help you spot potential entry and exit points with more confidence in trading.
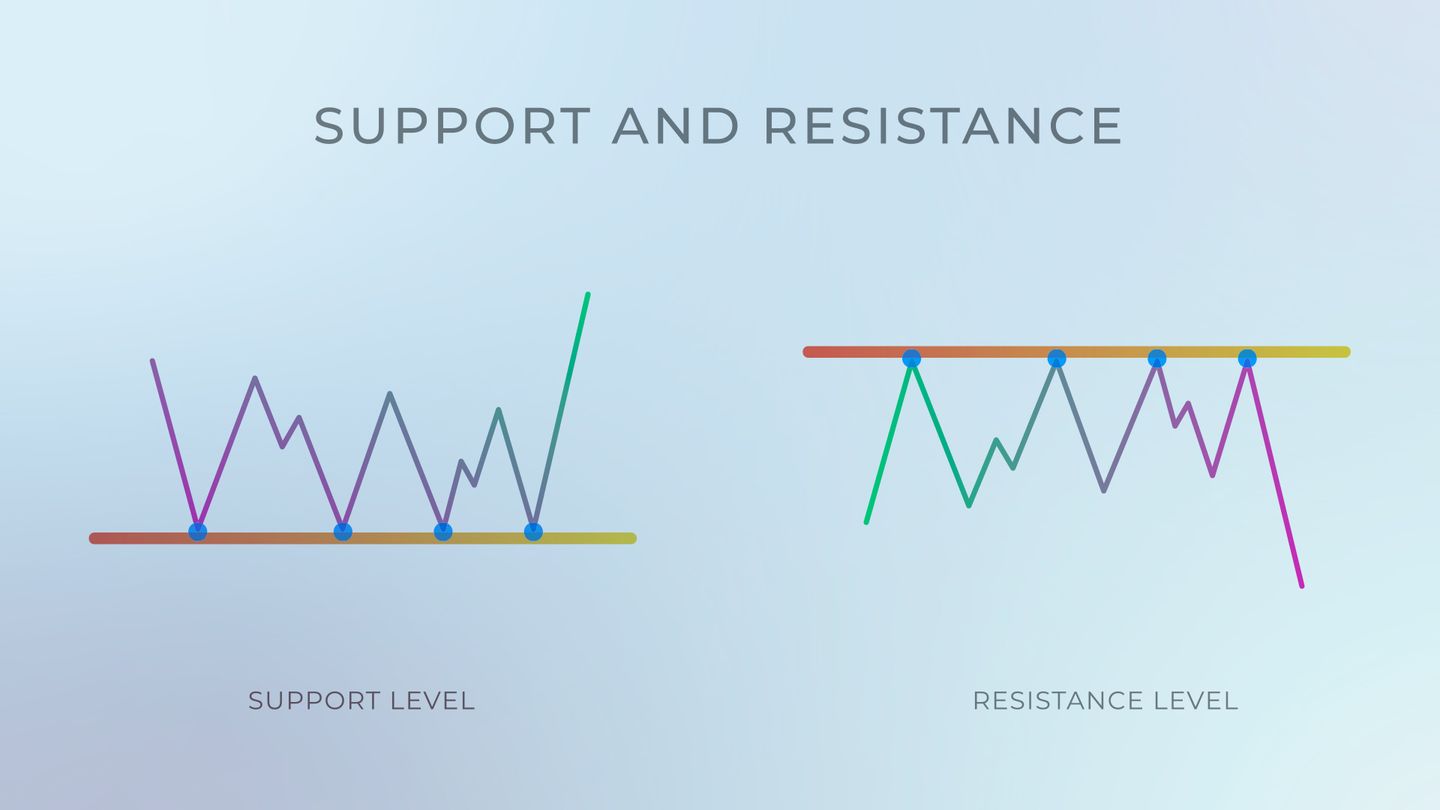
What is Support?
Support is a price level where buying pressure is strong enough to prevent the price from falling further. It’s like a floor, when price hits it, it tends to bounce up. Think of it as the market saying, “This price is cheap enough to buy.”
If price hits the same level multiple times and bounces back up, that level becomes a strong support.
Example: Imagine the forex pair trade GBPUSD falling to $1.33860 three times over one month, and each time it bounces. That’s a strong support zone.

Figure 1.1: GBPUSD 4HR Timeframe (TradingView)
What is Resistance?
On the other hand, resistance is the point at which selling pressure stops the price from increasing any higher. It functions as a ceiling. The market sees it as expensive. Price may try to rise and fail near the same level repeatedly.
Example: If USD/CHF struggles to go above 0.8250 for a couple weeks and then falls, that’s resistance.

Figure 1.1: USDCHF 1HR Timeframe (TradingView)
Why They Matter for Traders
Support and resistance help you:
- Enter trades at more favorable prices
- Set stop-losses just beyond these zones to manage risk
Take profits at logical points where price may reverse
They also form the basis for more advanced trading strategies like breakouts, pullbacks, and range trading.
Final Remark: Support Can Become Resistance (and Vice Versa)
When price breaks below support, that level often becomes new resistance. Similarly, breaking above resistance can turn it into new support.
This simple flip is used by many traders to confirm a breakout and plan their CFD trades with higher accuracy.